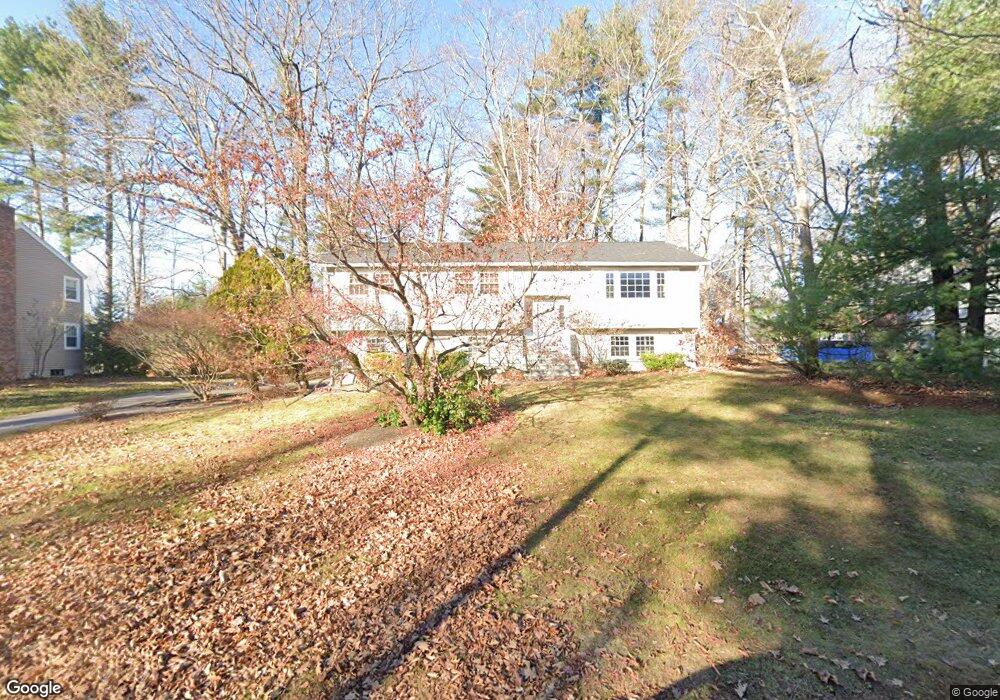
10 Marilyn Ave Exeter, NH 03833
Estimated Value: $594,971 - $689,000
3
Beds
3
Baths
1,332
Sq Ft
$484/Sq Ft
Est. Value
About This Home
This home is located at 10 Marilyn Ave, Exeter, NH 03833 and is currently estimated at $644,993, approximately $484 per square foot. 10 Marilyn Ave is a home located in Rockingham County with nearby schools including Main Street School, Lincoln Street Elementary School, and Cooperative Middle School.
Ownership History
Date
Name
Owned For
Owner Type
Purchase Details
Closed on
Mar 3, 2026
Sold by
Bishop Jonathan and Bishop Lisa J
Bought by
Bishop Ft 1999 and Bishop
Current Estimated Value
Purchase Details
Closed on
Jul 15, 1997
Sold by
Battit Sheryl
Bought by
Bishop Jonathan and Bishop Lisa J
Home Financials for this Owner
Home Financials are based on the most recent Mortgage that was taken out on this home.
Original Mortgage
$134,100
Interest Rate
7.86%
Mortgage Type
Purchase Money Mortgage
Create a Home Valuation Report for This Property
The Home Valuation Report is an in-depth analysis detailing your home's value as well as a comparison with similar homes in the area
Home Values in the Area
Average Home Value in this Area
Purchase History
| Date | Buyer | Sale Price | Title Company |
|---|---|---|---|
| Bishop Ft 1999 | -- | -- | |
| Bishop Jonathan | $149,000 | -- |
Source: Public Records
Mortgage History
| Date | Status | Borrower | Loan Amount |
|---|---|---|---|
| Previous Owner | Bishop Jonathan | $40,000 | |
| Previous Owner | Bishop Jonathan | $134,100 |
Source: Public Records
Tax History
| Year | Tax Paid | Tax Assessment Tax Assessment Total Assessment is a certain percentage of the fair market value that is determined by local assessors to be the total taxable value of land and additions on the property. | Land | Improvement |
|---|---|---|---|---|
| 2025 | $10,130 | $540,000 | $278,600 | $261,400 |
| 2024 | $9,607 | $540,000 | $278,600 | $261,400 |
| 2023 | $9,062 | $338,400 | $163,900 | $174,500 |
| 2022 | $8,375 | $338,400 | $163,900 | $174,500 |
| 2021 | $8,125 | $338,400 | $163,900 | $174,500 |
| 2020 | $8,287 | $338,400 | $163,900 | $174,500 |
| 2019 | $7,875 | $338,400 | $163,900 | $174,500 |
| 2018 | $7,106 | $258,400 | $120,500 | $137,900 |
| 2017 | $6,917 | $258,400 | $120,500 | $137,900 |
| 2016 | $6,780 | $258,400 | $120,500 | $137,900 |
| 2015 | $6,600 | $258,400 | $120,500 | $137,900 |
| 2014 | $6,843 | $262,600 | $109,500 | $153,100 |
| 2013 | $6,835 | $262,600 | $109,500 | $153,100 |
| 2011 | $6,639 | $262,600 | $109,500 | $153,100 |
Source: Public Records
Map
Nearby Homes
- 104 Robinhood Dr
- 4 Dow St
- 139 Robinhood Dr
- 14 Sir Lancelot Dr
- 6 Dow St
- 12 Cornwall St
- 50 Linden St
- 210 Robin Hood Ln Unit 210RH
- 220 Robinhood Dr Unit 220
- 113 Linden St
- 609 Canterbury Dr
- 23 Sumac St
- 204 N Haverhill Rd
- 614 Canterbury Dr
- 311 Friar Tuck Dr
- 13 Bell Ave
- 911 Camelot Dr
- 1013 Camelot Dr
- 802 Nottingham Dr Unit 79-802
- 807 Nottingham Dr
Your Personal Tour Guide
Ask me questions while you tour the home.