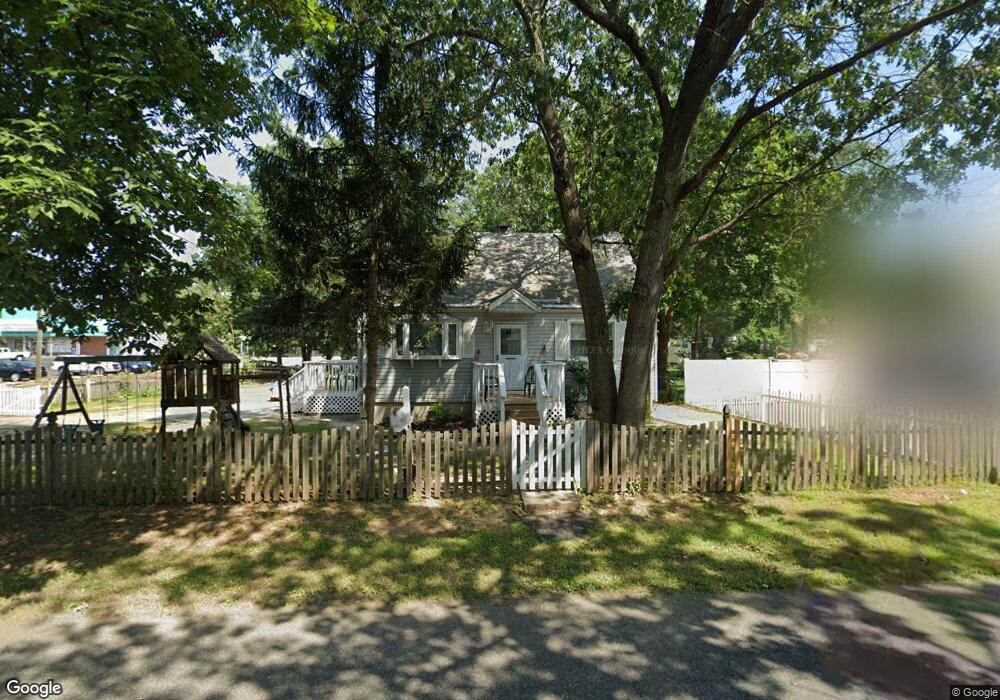
10 Marsad Dr Old Bridge, NJ 08857
Estimated Value: $452,628 - $533,000
3
Beds
1
Bath
1,080
Sq Ft
$460/Sq Ft
Est. Value
About This Home
This home is located at 10 Marsad Dr, Old Bridge, NJ 08857 and is currently estimated at $497,157, approximately $460 per square foot. 10 Marsad Dr is a home located in Middlesex County with nearby schools including Old Bridge High School and St. Thomas the Apostle School.
Ownership History
Date
Name
Owned For
Owner Type
Purchase Details
Closed on
Mar 7, 2017
Sold by
Federal Home Loan Mortgage Corporation
Bought by
Singh Chunniall and Singh Surajdai
Current Estimated Value
Purchase Details
Closed on
Aug 31, 2016
Sold by
Turner Lee Ann and Wachovia Bank Na
Bought by
Citimortgage Inc
Purchase Details
Closed on
Nov 21, 1997
Sold by
Bauerle Felicia
Bought by
Turner Lee
Home Financials for this Owner
Home Financials are based on the most recent Mortgage that was taken out on this home.
Original Mortgage
$122,000
Interest Rate
7.14%
Mortgage Type
FHA
Create a Home Valuation Report for This Property
The Home Valuation Report is an in-depth analysis detailing your home's value as well as a comparison with similar homes in the area
Home Values in the Area
Average Home Value in this Area
Purchase History
| Date | Buyer | Sale Price | Title Company |
|---|---|---|---|
| Singh Chunniall | -- | Commonwealth Title | |
| Citimortgage Inc | -- | None Available | |
| Turner Lee | $125,000 | -- |
Source: Public Records
Mortgage History
| Date | Status | Borrower | Loan Amount |
|---|---|---|---|
| Previous Owner | Turner Lee | $122,000 |
Source: Public Records
Tax History
| Year | Tax Paid | Tax Assessment Tax Assessment Total Assessment is a certain percentage of the fair market value that is determined by local assessors to be the total taxable value of land and additions on the property. | Land | Improvement |
|---|---|---|---|---|
| 2025 | $5,890 | $104,300 | $51,200 | $53,100 |
| 2024 | $5,650 | $104,300 | $51,200 | $53,100 |
Source: Public Records
Map
Nearby Homes
Your Personal Tour Guide
Ask me questions while you tour the home.