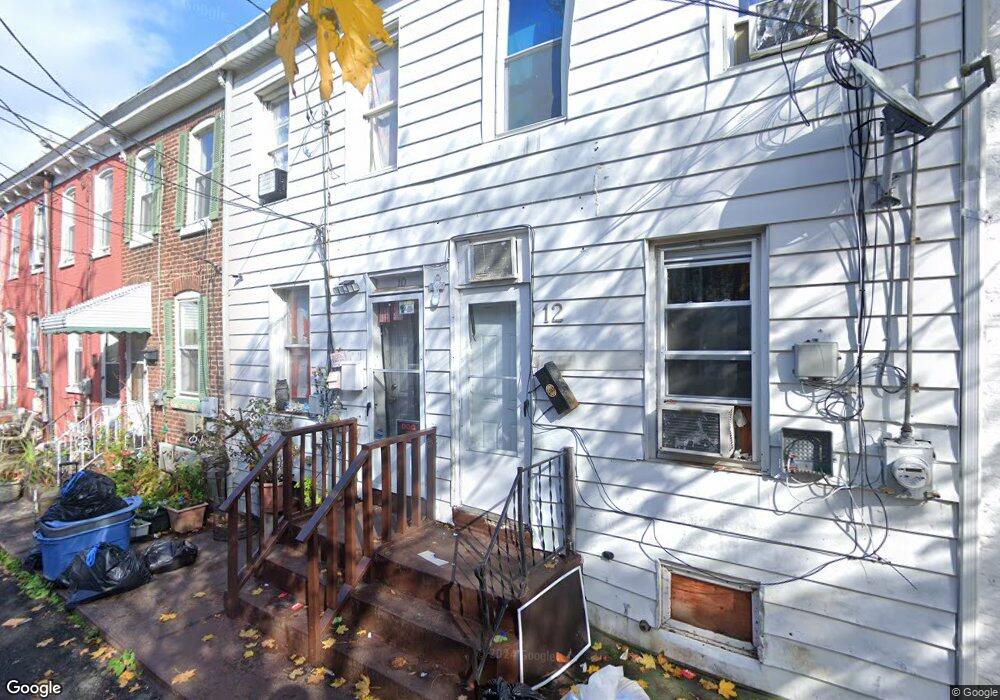
10 Mayers Ct Trenton, NJ 08611
South Trenton NeighborhoodEstimated Value: $113,797 - $177,000
2
Beds
1
Bath
696
Sq Ft
$203/Sq Ft
Est. Value
About This Home
This home is located at 10 Mayers Ct, Trenton, NJ 08611 and is currently estimated at $141,199, approximately $202 per square foot. 10 Mayers Ct is a home located in Mercer County with nearby schools including Mott Elementary School, Parker Elementary School, and Grace A Dunn Middle School.
Ownership History
Date
Name
Owned For
Owner Type
Purchase Details
Closed on
Nov 15, 2018
Sold by
Anderson David F and Anderson Barbara A
Bought by
Anderson David F and Anderson Barbara A
Current Estimated Value
Purchase Details
Closed on
Sep 2, 2010
Sold by
Fischer Leon
Bought by
Oakbrook Properties Llc
Purchase Details
Closed on
Jul 20, 2000
Sold by
Taplin Aaron
Bought by
Finkelstein Mark
Home Financials for this Owner
Home Financials are based on the most recent Mortgage that was taken out on this home.
Original Mortgage
$32,400
Interest Rate
8.21%
Purchase Details
Closed on
May 30, 2000
Sold by
Kapp Timothy
Bought by
Taplin Aaron
Home Financials for this Owner
Home Financials are based on the most recent Mortgage that was taken out on this home.
Original Mortgage
$32,400
Interest Rate
8.21%
Purchase Details
Closed on
Feb 21, 1995
Sold by
Rose Margaret
Bought by
Kapp Timothy
Create a Home Valuation Report for This Property
The Home Valuation Report is an in-depth analysis detailing your home's value as well as a comparison with similar homes in the area
Home Values in the Area
Average Home Value in this Area
Purchase History
| Date | Buyer | Sale Price | Title Company |
|---|---|---|---|
| Anderson David F | -- | None Available | |
| Oakbrook Properties Llc | $10,000 | Quick Title Search Llc | |
| Finkelstein Mark | $38,000 | -- | |
| Taplin Aaron | $10,000 | -- | |
| Kapp Timothy | $17,500 | -- |
Source: Public Records
Mortgage History
| Date | Status | Borrower | Loan Amount |
|---|---|---|---|
| Previous Owner | Finkelstein Mark | $32,400 |
Source: Public Records
Tax History Compared to Growth
Tax History
| Year | Tax Paid | Tax Assessment Tax Assessment Total Assessment is a certain percentage of the fair market value that is determined by local assessors to be the total taxable value of land and additions on the property. | Land | Improvement |
|---|---|---|---|---|
| 2025 | $1,694 | $29,200 | $6,800 | $22,400 |
| 2024 | $1,626 | $29,200 | $6,800 | $22,400 |
| 2023 | $1,626 | $29,200 | $6,800 | $22,400 |
| 2022 | $1,594 | $29,200 | $6,800 | $22,400 |
| 2021 | $1,621 | $29,200 | $6,800 | $22,400 |
| 2020 | $1,616 | $29,200 | $6,800 | $22,400 |
| 2019 | $1,590 | $29,200 | $6,800 | $22,400 |
| 2018 | $1,522 | $29,200 | $6,800 | $22,400 |
| 2017 | $1,447 | $29,200 | $6,800 | $22,400 |
| 2016 | $1,933 | $33,600 | $11,800 | $21,800 |
| 2015 | $1,926 | $33,600 | $11,800 | $21,800 |
| 2014 | $1,917 | $33,600 | $11,800 | $21,800 |
Source: Public Records
Map
Nearby Homes