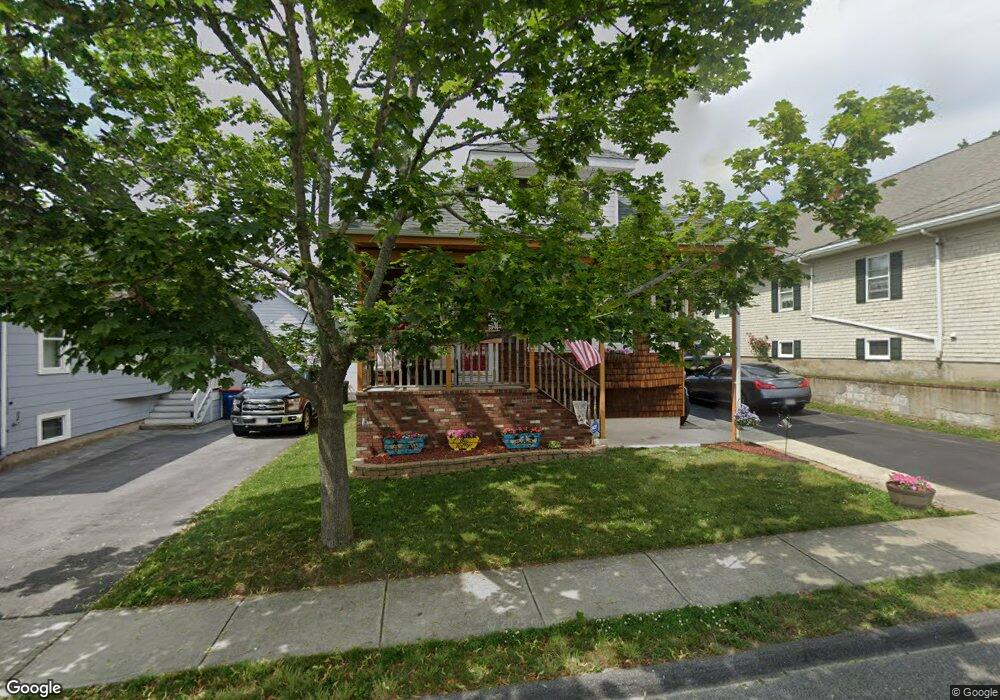
10 Morton St Fairhaven, MA 02719
North Fairhaven NeighborhoodEstimated Value: $400,000 - $426,000
3
Beds
2
Baths
1,077
Sq Ft
$384/Sq Ft
Est. Value
About This Home
This home is located at 10 Morton St, Fairhaven, MA 02719 and is currently estimated at $413,412, approximately $383 per square foot. 10 Morton St is a home located in Bristol County with nearby schools including Fairhaven High School, Alma Del Mar Charter School, and St. Joseph School.
Ownership History
Date
Name
Owned For
Owner Type
Purchase Details
Closed on
Jul 31, 2006
Sold by
P&C Rt and Langlois Carolyn A
Bought by
Medeiros Antonio and Sweeney-Medeiros Sheila
Current Estimated Value
Home Financials for this Owner
Home Financials are based on the most recent Mortgage that was taken out on this home.
Original Mortgage
$184,000
Interest Rate
6.67%
Mortgage Type
Purchase Money Mortgage
Purchase Details
Closed on
Jul 5, 2001
Sold by
Taffe Jean C
Bought by
Vieira Manuel P
Purchase Details
Closed on
Dec 30, 1998
Sold by
Monty Ovila J
Bought by
Taffe Jean C
Create a Home Valuation Report for This Property
The Home Valuation Report is an in-depth analysis detailing your home's value as well as a comparison with similar homes in the area
Home Values in the Area
Average Home Value in this Area
Purchase History
| Date | Buyer | Sale Price | Title Company |
|---|---|---|---|
| Medeiros Antonio | $230,000 | -- | |
| Vieira Manuel P | $124,900 | -- | |
| Taffe Jean C | $80,000 | -- |
Source: Public Records
Mortgage History
| Date | Status | Borrower | Loan Amount |
|---|---|---|---|
| Open | Taffe Jean C | $183,924 | |
| Closed | Taffe Jean C | $184,000 | |
| Closed | Taffe Jean C | $46,000 |
Source: Public Records
Tax History
| Year | Tax Paid | Tax Assessment Tax Assessment Total Assessment is a certain percentage of the fair market value that is determined by local assessors to be the total taxable value of land and additions on the property. | Land | Improvement |
|---|---|---|---|---|
| 2025 | $32 | $343,400 | $168,500 | $174,900 |
| 2024 | $3,088 | $334,600 | $168,500 | $166,100 |
| 2023 | $2,997 | $301,200 | $147,600 | $153,600 |
| 2022 | $2,900 | $283,800 | $137,200 | $146,600 |
| 2021 | $2,732 | $242,000 | $124,100 | $117,900 |
| 2020 | $2,677 | $242,000 | $124,100 | $117,900 |
| 2019 | $2,467 | $211,400 | $102,900 | $108,500 |
| 2018 | $2,345 | $199,600 | $98,000 | $101,600 |
| 2017 | $2,307 | $191,600 | $98,000 | $93,600 |
| 2016 | $2,233 | $183,300 | $98,000 | $85,300 |
| 2015 | $2,202 | $181,200 | $98,000 | $83,200 |
Source: Public Records
Map
Nearby Homes
Your Personal Tour Guide
Ask me questions while you tour the home.