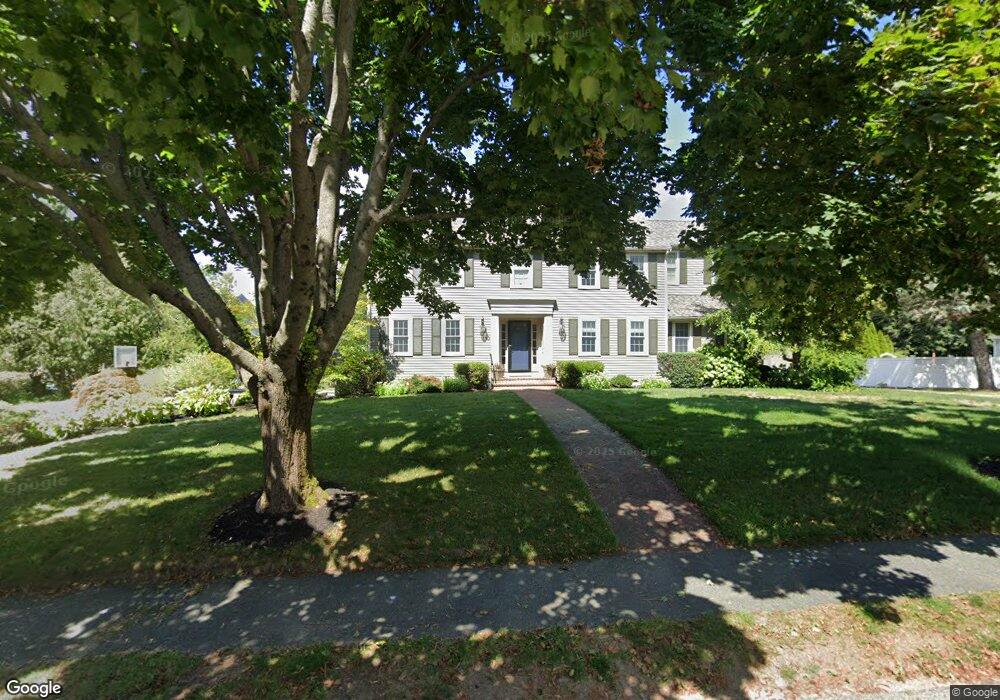
10 Myers Farm Rd Hingham, MA 02043
Estimated Value: $1,485,000 - $2,064,000
4
Beds
3
Baths
3,167
Sq Ft
$562/Sq Ft
Est. Value
About This Home
This home is located at 10 Myers Farm Rd, Hingham, MA 02043 and is currently estimated at $1,779,518, approximately $561 per square foot. 10 Myers Farm Rd is a home located in Plymouth County with nearby schools including Plymouth River Elementary School, South Shore Conservatory of Music Preschool, and St. Paul Elementary School.
Ownership History
Date
Name
Owned For
Owner Type
Purchase Details
Closed on
Jun 28, 2023
Sold by
Tomecek Christopher W and Tomecek Kerry
Bought by
10 Myers Family Rd Nt and Tomecek
Current Estimated Value
Purchase Details
Closed on
Apr 24, 1986
Bought by
Tomecek Christopher W and Tomecek Patricia
Create a Home Valuation Report for This Property
The Home Valuation Report is an in-depth analysis detailing your home's value as well as a comparison with similar homes in the area
Home Values in the Area
Average Home Value in this Area
Purchase History
| Date | Buyer | Sale Price | Title Company |
|---|---|---|---|
| 10 Myers Family Rd Nt | -- | None Available | |
| Tomecek Christopher W | $310,000 | -- |
Source: Public Records
Mortgage History
| Date | Status | Borrower | Loan Amount |
|---|---|---|---|
| Previous Owner | Tomecek Christopher W | $600,000 | |
| Previous Owner | Tomecek Christopher W | $128,000 | |
| Previous Owner | Tomecek Christopher W | $100,000 |
Source: Public Records
Tax History Compared to Growth
Tax History
| Year | Tax Paid | Tax Assessment Tax Assessment Total Assessment is a certain percentage of the fair market value that is determined by local assessors to be the total taxable value of land and additions on the property. | Land | Improvement |
|---|---|---|---|---|
| 2025 | $17,283 | $1,616,700 | $576,000 | $1,040,700 |
| 2024 | $15,877 | $1,463,300 | $576,000 | $887,300 |
| 2023 | $13,180 | $1,318,000 | $504,000 | $814,000 |
| 2022 | $12,017 | $1,039,500 | $400,000 | $639,500 |
| 2021 | $12,176 | $1,031,900 | $460,000 | $571,900 |
| 2020 | $11,898 | $1,031,900 | $460,000 | $571,900 |
| 2019 | $11,763 | $996,000 | $460,000 | $536,000 |
| 2018 | $11,723 | $996,000 | $460,000 | $536,000 |
| 2017 | $11,345 | $926,100 | $460,000 | $466,100 |
| 2016 | $11,295 | $904,300 | $438,200 | $466,100 |
| 2015 | $11,072 | $883,600 | $417,500 | $466,100 |
Source: Public Records
Map
Nearby Homes
- 8 Myers Farm Rd
- 16 Myers Farm Rd
- 12 Myers Farm Rd
- 14 Myers Farm Rd
- 15 Myers Farm Rd
- 6 Myers Farm Rd
- 7 Myers Farm Rd
- 17 Myers Farm Rd
- 18 Myers Farm Rd
- 2 Myers Farm Rd
- 83 Cross St
- 19 Myers Farm Rd
- 67 Cross St
- 22 Melody Ln
- 5 Butternut Ln
- 20 Myers Farm Rd
- 84 Cross St
- 4 Butternut Ln
- 78 Cross St
- 21 Myers Farm Rd