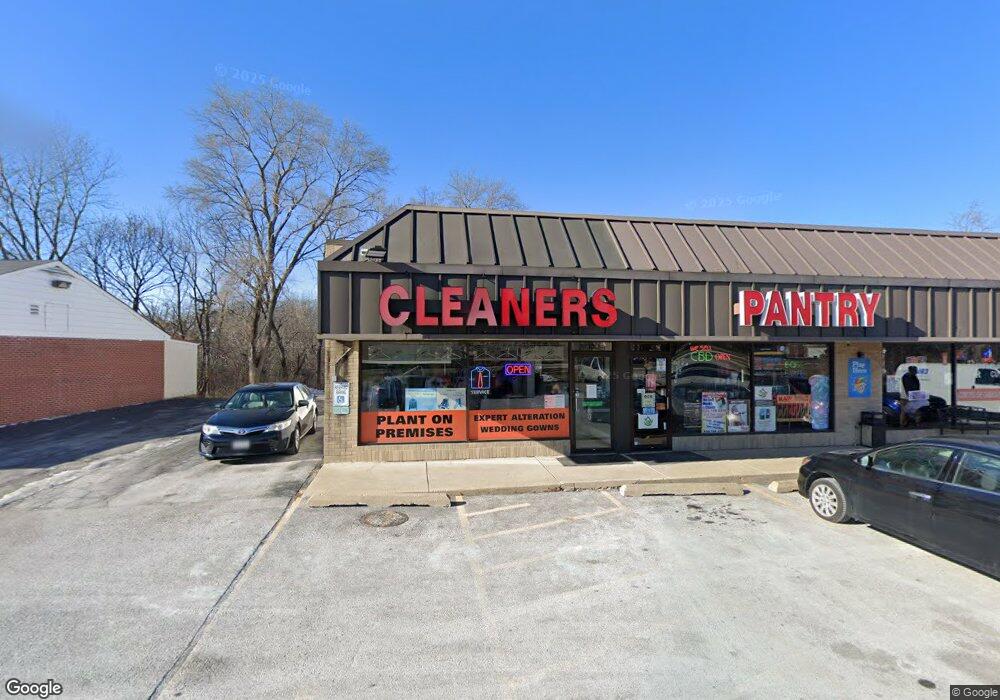
10 N Bartlett Rd Streamwood, IL 60107
Estimated Value: $649,928
--
Bed
--
Bath
4,800
Sq Ft
$135/Sq Ft
Est. Value
About This Home
This home is located at 10 N Bartlett Rd, Streamwood, IL 60107 and is currently estimated at $649,928, approximately $135 per square foot. 10 N Bartlett Rd is a home located in Cook County with nearby schools including Glenbrook Elementary School, Canton Middle School, and Streamwood High School.
Ownership History
Date
Name
Owned For
Owner Type
Purchase Details
Closed on
Aug 26, 2025
Sold by
Patel Pranav and Patel Phalguni
Bought by
Somyah Llc
Current Estimated Value
Purchase Details
Closed on
Feb 14, 2020
Sold by
Ashyana Llc Bartlett Management
Bought by
Patel Pranav and Patel Phalguni
Purchase Details
Closed on
May 29, 2014
Sold by
Ridgestone Bank
Bought by
Ashyana Llc Bartlett Management
Purchase Details
Closed on
Oct 31, 2013
Sold by
Sabeeh Abid N and Yonoszai Hosai S
Bought by
Ridgestone Bank
Purchase Details
Closed on
Jun 26, 2002
Sold by
Kim Jin H and Kim Sook
Bought by
Sabeeh Abid and Yonoszai Hosai
Purchase Details
Closed on
Jun 20, 2000
Sold by
Lasalle Bank National Assn
Bought by
Kim Jin H and Kim Sook
Purchase Details
Closed on
Nov 18, 1993
Sold by
Bank One Chicago Na
Bought by
Bank One Chicago Na
Create a Home Valuation Report for This Property
The Home Valuation Report is an in-depth analysis detailing your home's value as well as a comparison with similar homes in the area
Home Values in the Area
Average Home Value in this Area
Purchase History
| Date | Buyer | Sale Price | Title Company |
|---|---|---|---|
| Somyah Llc | -- | None Listed On Document | |
| Patel Pranav | $404,000 | Cambridge Title Company | |
| Ashyana Llc Bartlett Management | $195,000 | Ctcc | |
| Ridgestone Bank | -- | None Available | |
| Sabeeh Abid | $390,000 | -- | |
| Kim Jin H | -- | -- | |
| Bank One Chicago Na | -- | -- |
Source: Public Records
Tax History Compared to Growth
Tax History
| Year | Tax Paid | Tax Assessment Tax Assessment Total Assessment is a certain percentage of the fair market value that is determined by local assessors to be the total taxable value of land and additions on the property. | Land | Improvement |
|---|---|---|---|---|
| 2024 | $27,468 | $89,179 | $60,312 | $28,867 |
| 2023 | $26,750 | $89,179 | $60,312 | $28,867 |
| 2022 | $26,750 | $89,179 | $60,312 | $28,867 |
| 2021 | $26,159 | $71,554 | $60,312 | $11,242 |
| 2020 | $25,715 | $71,554 | $60,312 | $11,242 |
| 2019 | $22,864 | $71,554 | $60,312 | $11,242 |
| 2018 | $41,985 | $119,212 | $47,747 | $71,465 |
| 2017 | $41,365 | $119,088 | $47,747 | $71,341 |
| 2016 | $38,615 | $119,214 | $47,747 | $71,467 |
| 2015 | $30,215 | $85,186 | $42,721 | $42,465 |
| 2014 | $40,724 | $116,579 | $42,721 | $73,858 |
| 2013 | $36,429 | $107,614 | $42,721 | $64,893 |
Source: Public Records
Map
Nearby Homes
- 4 Haverton Ct Unit 2003
- 21 E Shag Bark Ln
- 102 Grow Ln
- 7 Marion Ln
- 28 N Oltendorf Rd
- 232 E Shag Bark Ln
- 120 S Chestnut Dr
- 16 Moraine Dr
- 120 Grow Ln
- 211 N Oltendorf Rd
- 28 Chaucer Ln
- 317 E Schaumburg Rd
- 305 S Bartlett Rd
- 318 Exmoor Dr
- 5 Canterbury Ct
- 412 Audubon Rd
- 406 Cahill Rd
- 302 S Oltendorf Rd
- 14 Buchanan Ln
- 340 Somerset Dr
- 12 N Bartlett Rd
- 14 N Bartlett Rd
- 16 N Bartlett Rd
- 4 N Bartlett Rd
- 4 N Bartlett Rd
- 20 N Bartlett Rd
- 2 N Bartlett Rd
- 16 Haverton Ct Unit 1901
- 18 Haverton Ct Unit 1804
- 22 Haverton Ct Unit 1802
- 14 Haverton Ct Unit 1902
- 24 Haverton Ct Unit 1801
- 1 Walden Trail Unit 2203
- 3 Walden Trail Unit 2202
- 12 Haverton Ct Unit 1903
- 27 Haverton Ct Unit 1704
- 10 Haverton Ct Unit 1904
- 5 Walden Trail Unit 2201
- 25 Haverton Ct Unit 1703
- 23 Haverton Ct Unit 1702