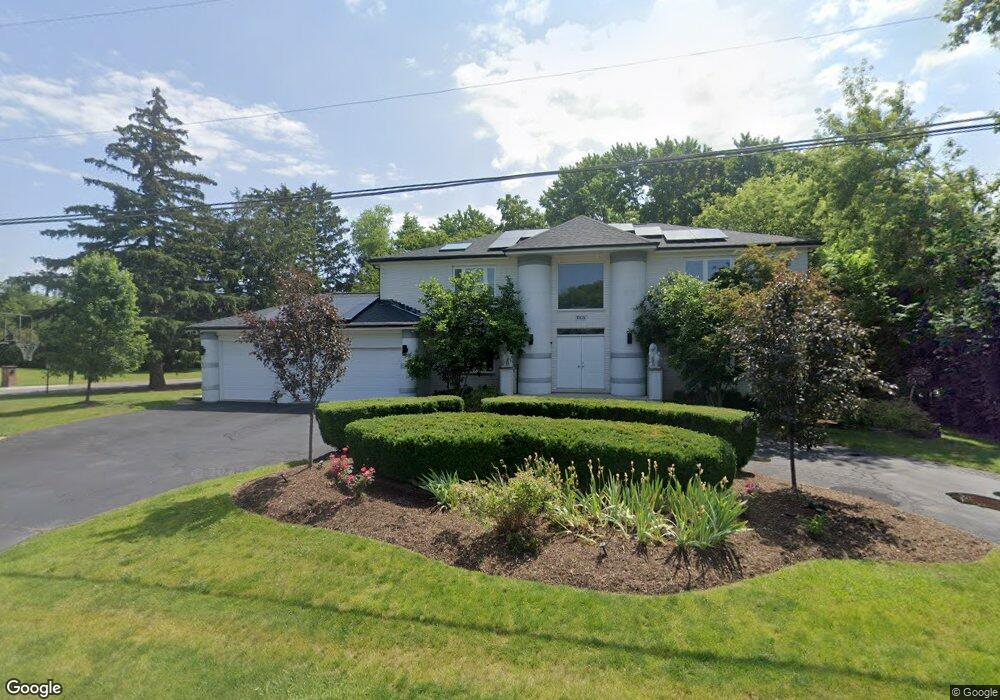
10 N Hotz Rd Lincolnshire, IL 60069
Prairie View NeighborhoodEstimated Value: $827,340 - $1,118,000
4
Beds
3
Baths
3,564
Sq Ft
$263/Sq Ft
Est. Value
About This Home
This home is located at 10 N Hotz Rd, Lincolnshire, IL 60069 and is currently estimated at $936,585, approximately $262 per square foot. 10 N Hotz Rd is a home located in Lake County with nearby schools including Laura B. Sprague School, Half Day School, and Daniel Wright Junior High School.
Ownership History
Date
Name
Owned For
Owner Type
Purchase Details
Closed on
Feb 22, 2020
Sold by
Malpekar Nilesh M and Malpekar Ratnangi N
Bought by
Malpekar Nilesh M and Malpekar Ratnangi N
Current Estimated Value
Purchase Details
Closed on
Sep 16, 2014
Sold by
An Shuxian and Xie Min
Bought by
Malpekar Nilesh and Malpekar Ratnangi
Home Financials for this Owner
Home Financials are based on the most recent Mortgage that was taken out on this home.
Original Mortgage
$544,850
Interest Rate
3.62%
Mortgage Type
New Conventional
Purchase Details
Closed on
Jun 28, 2013
Sold by
Caiolino Liborio and Calolino Roxanne
Bought by
An Shuxian and Xie Min
Home Financials for this Owner
Home Financials are based on the most recent Mortgage that was taken out on this home.
Original Mortgage
$500,000
Interest Rate
2.75%
Mortgage Type
Adjustable Rate Mortgage/ARM
Create a Home Valuation Report for This Property
The Home Valuation Report is an in-depth analysis detailing your home's value as well as a comparison with similar homes in the area
Home Values in the Area
Average Home Value in this Area
Purchase History
| Date | Buyer | Sale Price | Title Company |
|---|---|---|---|
| Malpekar Nilesh M | -- | None Available | |
| Malpekar Nilesh | $641,000 | Greater Illinois Title Co | |
| An Shuxian | $625,000 | Attorneys Title Guaranty Fun |
Source: Public Records
Mortgage History
| Date | Status | Borrower | Loan Amount |
|---|---|---|---|
| Previous Owner | Malpekar Nilesh | $544,850 | |
| Previous Owner | An Shuxian | $500,000 |
Source: Public Records
Tax History Compared to Growth
Tax History
| Year | Tax Paid | Tax Assessment Tax Assessment Total Assessment is a certain percentage of the fair market value that is determined by local assessors to be the total taxable value of land and additions on the property. | Land | Improvement |
|---|---|---|---|---|
| 2024 | $17,416 | $207,977 | $56,929 | $151,048 |
| 2023 | $16,667 | $196,242 | $53,717 | $142,525 |
| 2022 | $16,667 | $189,786 | $51,950 | $137,836 |
| 2021 | $16,026 | $187,740 | $51,390 | $136,350 |
| 2020 | $15,629 | $188,380 | $51,565 | $136,815 |
| 2019 | $15,167 | $187,686 | $51,375 | $136,311 |
| 2018 | $18,125 | $229,266 | $55,848 | $173,418 |
| 2017 | $17,867 | $223,914 | $54,544 | $169,370 |
| 2016 | $17,153 | $214,415 | $52,230 | $162,185 |
| 2015 | $16,814 | $200,519 | $48,845 | $151,674 |
| 2014 | $17,081 | $203,811 | $52,459 | $151,352 |
| 2012 | -- | $204,219 | $52,564 | $151,655 |
Source: Public Records
Map
Nearby Homes
- 11 Beaconsfield Ct Unit 11
- 3 Dartmouth Ct
- 23347 N Indian Creek Rd
- 2505 Palazzo Dr
- 23061 N Apple Hill Ln
- 2470 Palazzo Ct
- 1316 Christine Ct
- 15444 W Half Day Rd
- 1255 Danforth Ct
- 16231 W Port Clinton Rd
- 1199 E Port Clinton Rd Unit 504
- 1199 E Port Clinton Rd Unit 304
- 396 Forest Edge Dr
- 22825 N Prairie Rd
- 445 Village Green S Unit 201
- 445 Village Green S Unit 301
- 425 Village Green Unit 213
- 1270 Georgetown Way Unit 232
- 4 Daybreak Terrace
- 5 Willow Pkwy Unit 892
- 10 N Hotz Rd
- 10 Hotz Rd
- 8 Hotz Rd
- 3 Abbey Rd
- 5 Middlesex Ct
- 2 Abbey Rd
- 6 Hotz Rd
- 1 Middlesex Ct
- 1 Northfield Ct
- 4 Abbey Rd
- 4 Middlesex Ct
- 15 Beaconsfield Ct Unit 15
- 3 Middlesex Ct
- 2 Northfield Ct
- 2 Middlesex Ct
- 14 Beaconsfield Ct Unit 14
- 5 Northfield Ct
- 13 Beaconsfield Ct Unit 13
- 16 Beaconsfield Ct Unit 16
- 23153 N Hotz Rd