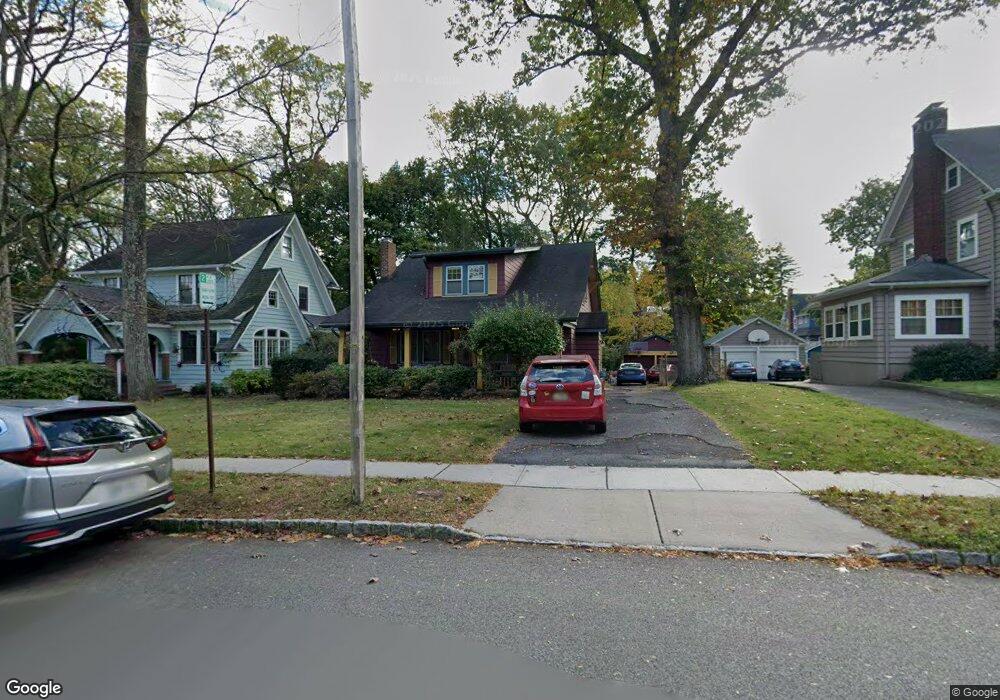
10 Nassau Rd Montclair, NJ 07043
Estimated Value: $923,000 - $1,324,000
Studio
--
Bath
1,736
Sq Ft
$669/Sq Ft
Est. Value
About This Home
This home is located at 10 Nassau Rd, Montclair, NJ 07043 and is currently estimated at $1,161,480, approximately $669 per square foot. 10 Nassau Rd is a home located in Essex County with nearby schools including Bradford School, Hillside School, and Nishuane School.
Ownership History
Date
Name
Owned For
Owner Type
Purchase Details
Closed on
Dec 2, 1997
Sold by
Keyles Stanley
Bought by
Braley Peter and Braley Sarah
Current Estimated Value
Home Financials for this Owner
Home Financials are based on the most recent Mortgage that was taken out on this home.
Original Mortgage
$190,000
Outstanding Balance
$31,804
Interest Rate
7.11%
Estimated Equity
$1,129,676
Purchase Details
Closed on
Mar 28, 1989
Sold by
Kenny Jr Charles F and Kenny Catherine K
Bought by
Keyles Stanley and Keyles Claire G
Create a Home Valuation Report for This Property
The Home Valuation Report is an in-depth analysis detailing your home's value as well as a comparison with similar homes in the area
Home Values in the Area
Average Home Value in this Area
Purchase History
| Date | Buyer | Sale Price | Title Company |
|---|---|---|---|
| Braley Peter | $238,000 | -- | |
| Keyles Stanley | $230,000 | -- |
Source: Public Records
Mortgage History
| Date | Status | Borrower | Loan Amount |
|---|---|---|---|
| Open | Braley Peter | $190,000 |
Source: Public Records
Tax History
| Year | Tax Paid | Tax Assessment Tax Assessment Total Assessment is a certain percentage of the fair market value that is determined by local assessors to be the total taxable value of land and additions on the property. | Land | Improvement |
|---|---|---|---|---|
| 2025 | $24,194 | $715,800 | $398,600 | $317,200 |
| 2024 | $24,194 | $715,800 | $398,600 | $317,200 |
| 2022 | $23,536 | $715,800 | $398,600 | $317,200 |
| 2021 | $23,128 | $715,800 | $398,600 | $317,200 |
| 2020 | $22,755 | $715,800 | $398,600 | $317,200 |
| 2019 | $22,519 | $715,800 | $398,600 | $317,200 |
| 2018 | $22,147 | $715,800 | $398,600 | $317,200 |
| 2017 | $23,509 | $629,600 | $380,800 | $248,800 |
| 2016 | $22,880 | $629,600 | $380,800 | $248,800 |
| 2015 | $22,200 | $629,600 | $380,800 | $248,800 |
| 2014 | $21,457 | $511,900 | $380,800 | $131,100 |
Source: Public Records
Map
Nearby Homes
- 31 Nassau Rd
- 15 Garfield Place
- 8 MacOpin Ave
- 30 Wellesley Rd
- 138 Alexander Ave
- 1283 Valley Rd Unit 7
- 8350 Blvd E Unit 3A
- 14 Marion Rd
- 11 Valley Place
- 16 Lenape Trail
- 11 Kenneth Rd
- 16 Lenape Trail
- 117 Yantacaw Brook Rd
- 10 Mountain Terrace
- 620 Highland Ave
- 200 Inwood Ave
- 29 Norwood Ave
- 391 Up Mountain Ave
- 112 Heller Way
- 28 Overlook Rd
Your Personal Tour Guide
Ask me questions while you tour the home.