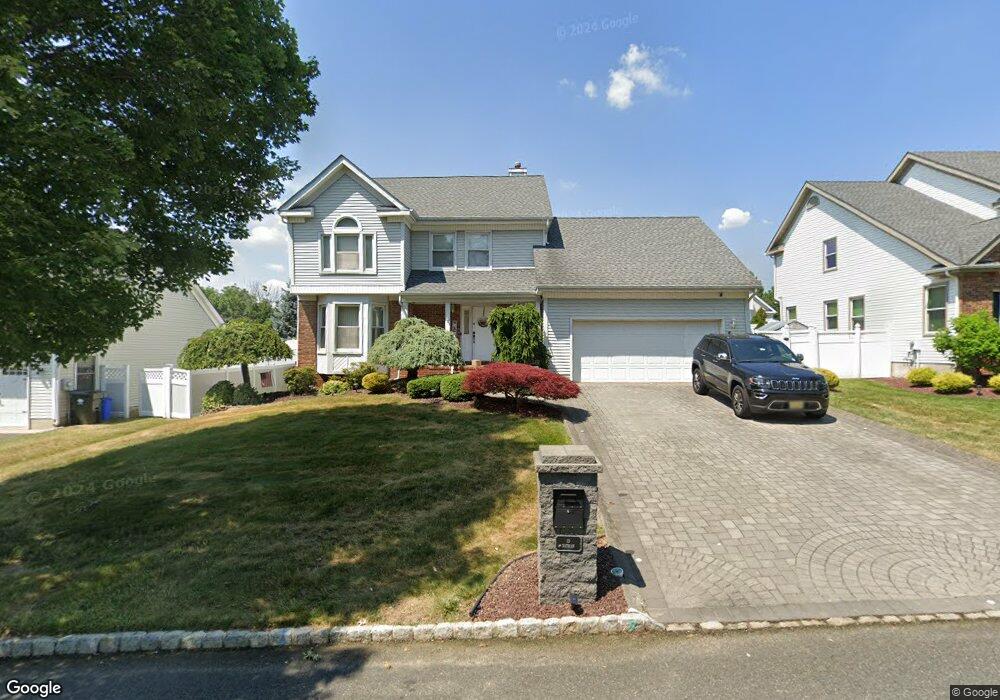
10 Nathan Dr Old Bridge, NJ 08857
Estimated Value: $726,829 - $838,000
Studio
--
Bath
1,876
Sq Ft
$419/Sq Ft
Est. Value
About This Home
This home is located at 10 Nathan Dr, Old Bridge, NJ 08857 and is currently estimated at $785,457, approximately $418 per square foot. 10 Nathan Dr is a home located in Middlesex County with nearby schools including Old Bridge High School, St. Ambrose School, and Calvary Christian School.
Ownership History
Date
Name
Owned For
Owner Type
Purchase Details
Closed on
Apr 30, 1998
Sold by
Granville Kevin
Bought by
James Di Robbio and Di Robbio Lori
Current Estimated Value
Purchase Details
Closed on
Oct 27, 1993
Sold by
Rindenau Michael
Bought by
Granville Kevin and Granville Anna
Home Financials for this Owner
Home Financials are based on the most recent Mortgage that was taken out on this home.
Original Mortgage
$189,000
Interest Rate
6.77%
Create a Home Valuation Report for This Property
The Home Valuation Report is an in-depth analysis detailing your home's value as well as a comparison with similar homes in the area
Home Values in the Area
Average Home Value in this Area
Purchase History
| Date | Buyer | Sale Price | Title Company |
|---|---|---|---|
| James Di Robbio | $232,500 | -- | |
| Granville Kevin | $210,000 | -- |
Source: Public Records
Mortgage History
| Date | Status | Borrower | Loan Amount |
|---|---|---|---|
| Previous Owner | Granville Kevin | $189,000 |
Source: Public Records
Tax History
| Year | Tax Paid | Tax Assessment Tax Assessment Total Assessment is a certain percentage of the fair market value that is determined by local assessors to be the total taxable value of land and additions on the property. | Land | Improvement |
|---|---|---|---|---|
| 2025 | $11,983 | $212,200 | $71,000 | $141,200 |
| 2024 | $11,495 | $212,200 | $71,000 | $141,200 |
Source: Public Records
Map
Nearby Homes
- 3 Falcon Ct
- 55 Valley Vale Dr
- 60 Amber Dr
- 18 Tall Oaks Ct
- 97 Osprey Dr
- 20 Valley Vale Dr
- 28 Walden Ct
- 18 Bruce St
- 220 Ticetown Rd
- 47 Walden Ct
- 37 Walden Ct
- 104 Diamond Ln
- 143 Ticetown Rd
- 120 Diamond Ln
- 65 Diamond Ln
- 18 Grace Dr
- 10101 Falston Cir Unit 101
- 10101 Falston Cir
- 2327 Falston Cir
- 2211 Falston Cir Unit 211
Your Personal Tour Guide
Ask me questions while you tour the home.