10 Nell Ct Dumont, NJ 07628
Dumont AreaEstimated Value: $701,000 - $830,244
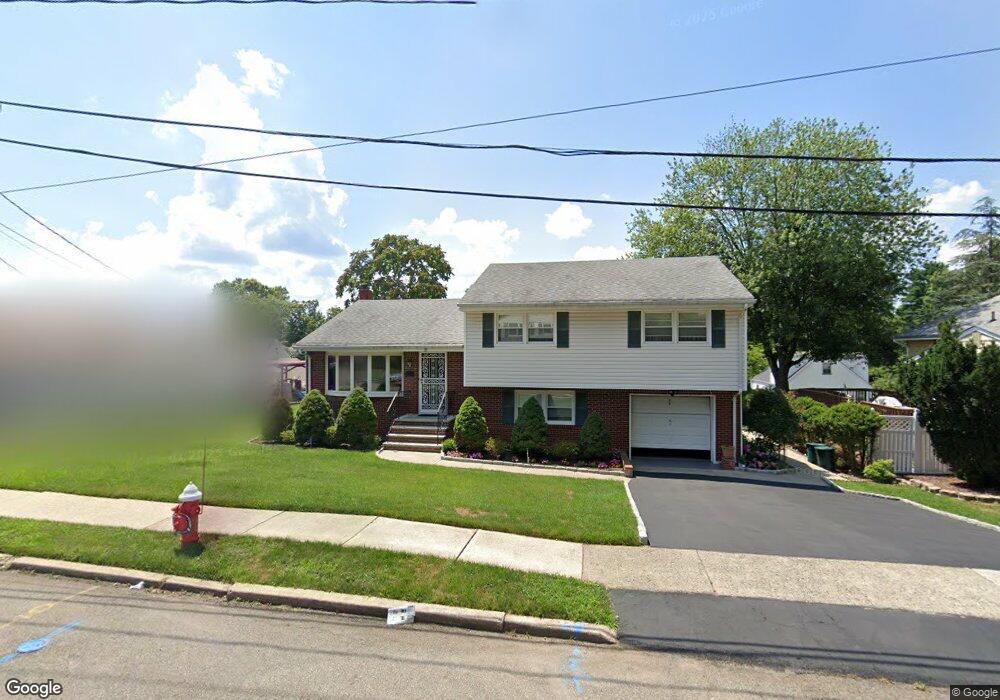
About This Home
This home is located at 10 Nell Ct, Dumont, NJ 07628 and is currently estimated at $744,061, approximately $427 per square foot. 10 Nell Ct is a home located in Bergen County with nearby schools including Dumont High School.
Ownership History
We collect this data history from publicly available records. To have your information removed, we recommend requesting removal directly through your county’s website.
Purchase Details
Home Financials for this Owner
Home Financials are based on the most recent Mortgage that was taken out on this home.Home Values in the Area
Average Home Value in this Area
Purchase History
We collect this data history from publicly available records. To have your information removed, we recommend requesting removal directly through your county’s website.
| Date | Buyer | Sale Price | Title Company |
|---|---|---|---|
| $535,000 | Green Label Title |
Mortgage History
We collect this data history from publicly available records. To have your information removed, we recommend requesting removal directly through your county’s website.
| Date | Status | Borrower | Loan Amount |
|---|---|---|---|
| Open | $498,250 |
Tax History
We collect this data history from publicly available records. To have your information removed, we recommend requesting removal directly through your county’s website.
| Year | Tax Paid | Tax Assessment Tax Assessment Total Assessment is a certain percentage of the fair market value that is determined by local assessors to be the total taxable value of land and additions on the property. | Land | Improvement |
|---|---|---|---|---|
| 2026 | $13,591 | $626,300 | $367,500 | $258,800 |
| 2025 | $13,845 | $580,800 | $335,000 | $245,800 |
| 2024 | $13,505 | $340,600 | $180,000 | $160,600 |
| 2023 | $13,226 | $340,600 | $180,000 | $160,600 |
| 2022 | $13,226 | $340,600 | $180,000 | $160,600 |
| 2021 | $12,236 | $340,600 | $180,000 | $160,600 |
| 2020 | $12,803 | $340,600 | $180,000 | $160,600 |
| 2019 | $12,497 | $340,600 | $180,000 | $160,600 |
| 2018 | $12,241 | $340,600 | $180,000 | $160,600 |
| 2017 | $12,006 | $340,600 | $180,000 | $160,600 |
| 2016 | $11,727 | $340,600 | $180,000 | $160,600 |
| 2015 | $11,458 | $340,600 | $180,000 | $160,600 |
| 2014 | $11,233 | $340,600 | $180,000 | $160,600 |
Map
- 117 Roxbury Rd
- 38 Schraalenburgh Rd
- 14 Poplar St
- 50 Harding Ave
- 101 Larch Ave
- 50 Whitman St
- 66 Grant Ave Unit C
- 31 Wood Place
- 173 Schraalenburgh Rd
- 160 Beacon St
- 15 Laurel Ave
- 455 Sunset Ave
- 135 Cresskill Ave
- 305 Depew St
- 7 Harrison St
- 63 Cypress Rd
- 65 E Linden Ave
- 199 Whitman St
- 7 Hardenburgh Ave
- 51 Charles St
Ask me questions while you tour the home.