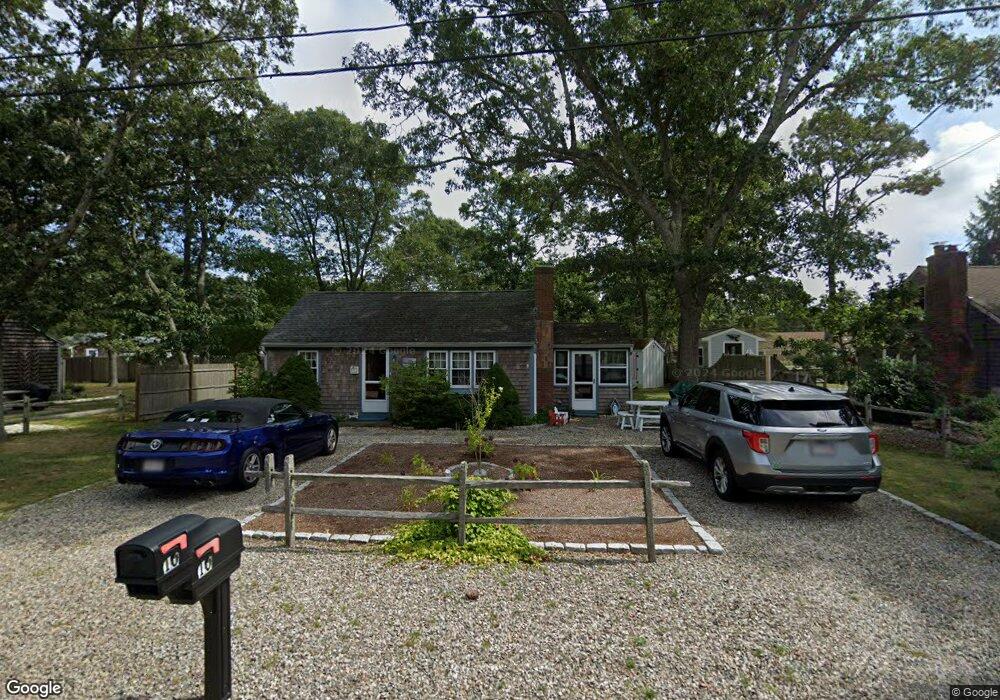
10 Norse Rd South Dennis, MA 02660
South Dennis NeighborhoodEstimated Value: $410,000 - $495,000
2
Beds
1
Bath
800
Sq Ft
$569/Sq Ft
Est. Value
About This Home
This home is located at 10 Norse Rd, South Dennis, MA 02660 and is currently estimated at $454,921, approximately $568 per square foot. 10 Norse Rd is a home located in Barnstable County with nearby schools including Dennis-Yarmouth Regional High School and St. Pius X. School.
Ownership History
Date
Name
Owned For
Owner Type
Purchase Details
Closed on
Dec 21, 2016
Sold by
Casey James F and Casey Mary M
Bought by
Casey South Dennis Ft
Current Estimated Value
Purchase Details
Closed on
Oct 21, 1994
Sold by
Gould Joan A and Gould Robert J
Bought by
Casey James F and Casey Mary M
Home Financials for this Owner
Home Financials are based on the most recent Mortgage that was taken out on this home.
Original Mortgage
$63,900
Interest Rate
8.49%
Mortgage Type
Purchase Money Mortgage
Create a Home Valuation Report for This Property
The Home Valuation Report is an in-depth analysis detailing your home's value as well as a comparison with similar homes in the area
Home Values in the Area
Average Home Value in this Area
Purchase History
| Date | Buyer | Sale Price | Title Company |
|---|---|---|---|
| Casey South Dennis Ft | -- | -- | |
| Casey James F | $79,900 | -- |
Source: Public Records
Mortgage History
| Date | Status | Borrower | Loan Amount |
|---|---|---|---|
| Previous Owner | Casey James F | $63,900 |
Source: Public Records
Tax History Compared to Growth
Tax History
| Year | Tax Paid | Tax Assessment Tax Assessment Total Assessment is a certain percentage of the fair market value that is determined by local assessors to be the total taxable value of land and additions on the property. | Land | Improvement |
|---|---|---|---|---|
| 2025 | $1,446 | $334,000 | $126,600 | $207,400 |
| 2024 | $1,315 | $299,500 | $121,800 | $177,700 |
| 2023 | $1,271 | $272,200 | $110,700 | $161,500 |
| 2022 | $1,284 | $229,200 | $110,800 | $118,400 |
| 2021 | $1,226 | $203,300 | $108,600 | $94,700 |
| 2020 | $1,186 | $194,500 | $108,600 | $85,900 |
| 2019 | $1,194 | $193,500 | $117,200 | $76,300 |
| 2018 | $1,077 | $169,900 | $101,400 | $68,500 |
| 2017 | $1,031 | $167,700 | $101,400 | $66,300 |
| 2016 | $1,052 | $161,100 | $106,500 | $54,600 |
| 2015 | $1,031 | $161,100 | $106,500 | $54,600 |
| 2014 | $946 | $148,900 | $91,300 | $57,600 |
Source: Public Records
Map
Nearby Homes
- 153 Bayridge Dr
- 4 Ebb Rd
- 11 Uncle Stanleys Way
- 17 Margate Ln
- 15 Captain Jud Rd
- 118 Driftwood Ln
- 17 Fairmount Rd
- 129 Driftwood Ln
- 17 Fairmount Rd
- 13 Covey Dr
- 10 Joanne Dr
- 111 Merchant Ave
- 7 Vinland Dr
- 25 Skerry Rd
- 1 Norseman Dr
- 6 Nimble Hill Dr
- 4 Old Colony Way
- 62 Old Fish House Rd
- 6 Hawthorn St
- 32 Captain Walsh Dr
- 6 Norse Rd
- 12 Norse Rd
- 11 Olivia Walker Way
- 9 Olivia Walker Way
- 15 Olivia Walker Way
- 5 Norse Rd
- 16 Norse Rd
- 3 Norse Rd
- 5 Olivia Walker Way
- 239 Mayfair Rd
- 9 Norse Rd
- 19 Olivia Walker Way
- 13 Norse Rd
- 2 Peter Oliver Rd
- 20 Norse Rd
- 10 Olivia Walker Way
- 1 Olivia Walker Way
- 16 Olivia Walker Way
- 4 Peter Oliver Rd
- 20 Olivia Walker Way