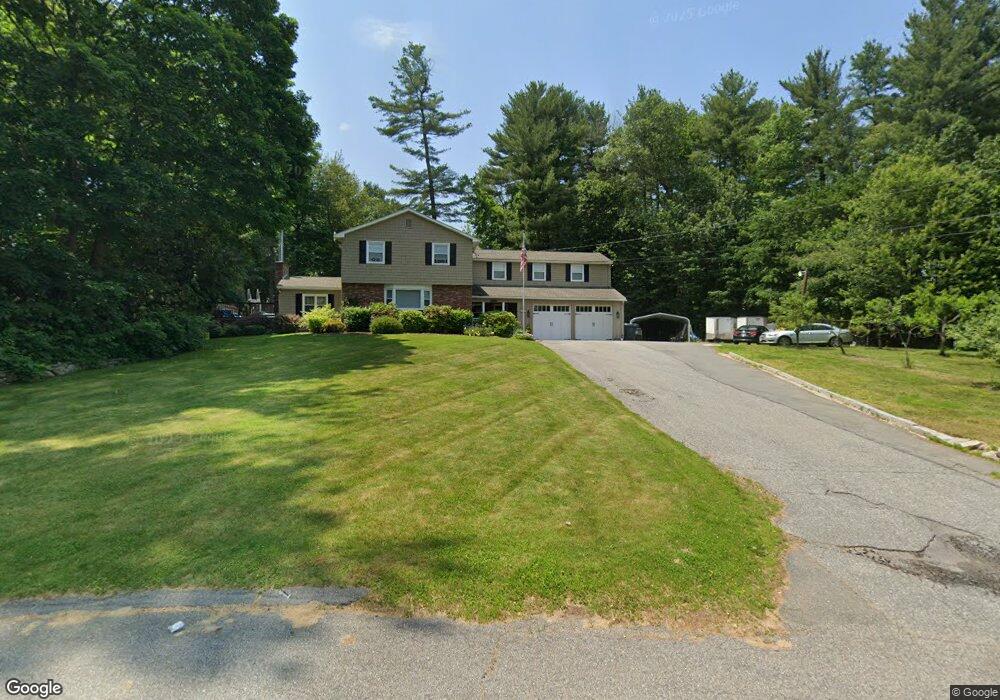
10 O St Dracut, MA 01826
Estimated Value: $791,000 - $1,141,000
5
Beds
4
Baths
4,156
Sq Ft
$223/Sq Ft
Est. Value
About This Home
This home is located at 10 O St, Dracut, MA 01826 and is currently estimated at $928,181, approximately $223 per square foot. 10 O St is a home located in Middlesex County with nearby schools including Brookside Elementary School, Richardson Middle School, and Dracut Senior High School.
Ownership History
Date
Name
Owned For
Owner Type
Purchase Details
Closed on
Apr 26, 2002
Sold by
Stemarie Ruth A and Miller Joseph J
Bought by
Miner Kathleen M and Bovill Scott J
Current Estimated Value
Home Financials for this Owner
Home Financials are based on the most recent Mortgage that was taken out on this home.
Original Mortgage
$160,000
Interest Rate
7.05%
Mortgage Type
Purchase Money Mortgage
Purchase Details
Closed on
Dec 15, 2000
Sold by
Gys Joseph J and Gys Maureen
Bought by
Stemarie Ruth A and Miller Joseph J
Home Financials for this Owner
Home Financials are based on the most recent Mortgage that was taken out on this home.
Original Mortgage
$240,000
Interest Rate
7.7%
Mortgage Type
Purchase Money Mortgage
Purchase Details
Closed on
Nov 18, 1994
Sold by
Carmona James and Carmona Brenda
Bought by
Gys Joseph J and Gys Maureen
Create a Home Valuation Report for This Property
The Home Valuation Report is an in-depth analysis detailing your home's value as well as a comparison with similar homes in the area
Home Values in the Area
Average Home Value in this Area
Purchase History
| Date | Buyer | Sale Price | Title Company |
|---|---|---|---|
| Miner Kathleen M | $370,000 | -- | |
| Stemarie Ruth A | $350,000 | -- | |
| Gys Joseph J | $185,500 | -- |
Source: Public Records
Mortgage History
| Date | Status | Borrower | Loan Amount |
|---|---|---|---|
| Open | Gys Joseph J | $121,500 | |
| Closed | Gys Joseph J | $160,000 | |
| Closed | Gys Joseph J | $160,000 | |
| Previous Owner | Gys Joseph J | $240,000 |
Source: Public Records
Tax History Compared to Growth
Tax History
| Year | Tax Paid | Tax Assessment Tax Assessment Total Assessment is a certain percentage of the fair market value that is determined by local assessors to be the total taxable value of land and additions on the property. | Land | Improvement |
|---|---|---|---|---|
| 2025 | $9,152 | $904,300 | $223,700 | $680,600 |
| 2024 | $8,895 | $851,200 | $213,100 | $638,100 |
| 2023 | $8,632 | $745,400 | $185,300 | $560,100 |
| 2022 | $8,544 | $695,200 | $168,500 | $526,700 |
| 2021 | $5,570 | $630,000 | $153,100 | $476,900 |
| 2020 | $7,881 | $590,300 | $148,400 | $441,900 |
| 2019 | $7,491 | $544,800 | $141,400 | $403,400 |
| 2018 | $7,652 | $527,300 | $141,400 | $385,900 |
| 2017 | $7,343 | $527,300 | $141,400 | $385,900 |
| 2016 | $7,395 | $498,300 | $135,900 | $362,400 |
| 2015 | $7,054 | $472,500 | $135,900 | $336,600 |
| 2014 | $6,525 | $450,300 | $135,900 | $314,400 |
Source: Public Records
Map
Nearby Homes
- 97 Passaconaway Dr
- 10 Edwards St
- 17 Spare St
- 53 4th St
- 14 D St
- 79 B St
- 67 2nd St
- 1905 Lakeview Ave
- 73 A&B Mammoth Rd
- 73 Mammoth Rd Unit A&B
- 73 Mammoth Rd
- 29 Mill St Unit B
- 671 Nashua Rd
- 9 Cornstalk Ln
- 19 Mcgrath Rd
- 124 Tennis Plaza Rd Unit 22
- 53 Vinal St
- 35 Camilla Ave
- 25 Settlers Way
- 94 Tennis Plaza Rd Unit 10