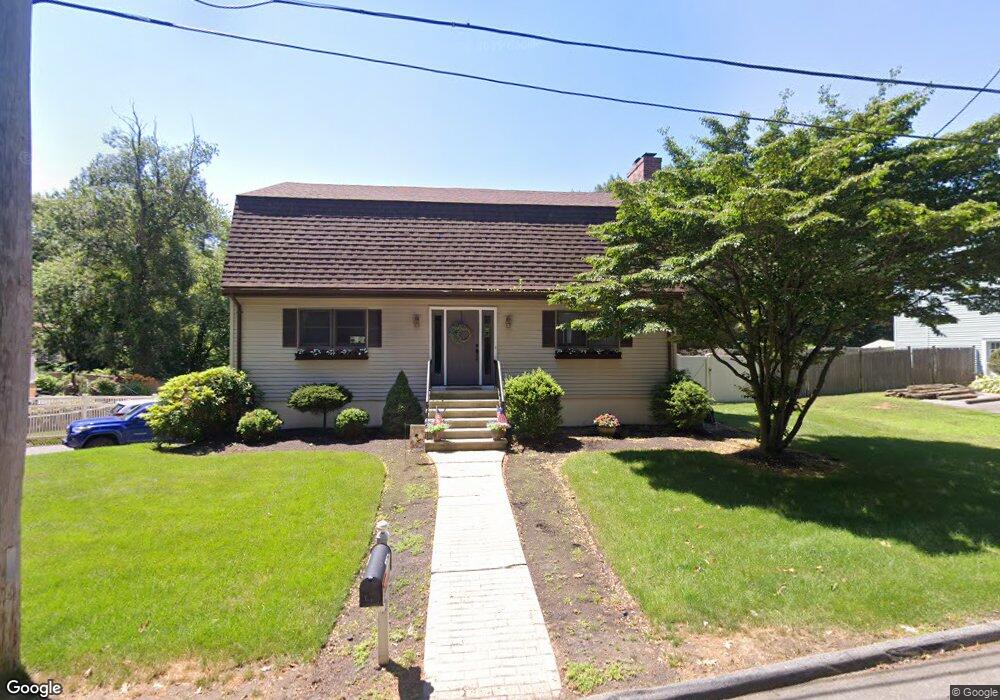
10 Oak Point Rd Saugus, MA 01906
Lynnhurst NeighborhoodEstimated Value: $792,363 - $906,000
4
Beds
2
Baths
2,276
Sq Ft
$381/Sq Ft
Est. Value
About This Home
This home is located at 10 Oak Point Rd, Saugus, MA 01906 and is currently estimated at $867,341, approximately $381 per square foot. 10 Oak Point Rd is a home located in Essex County with nearby schools including Saugus High School and Pioneer Charter School Of Science II.
Ownership History
Date
Name
Owned For
Owner Type
Purchase Details
Closed on
Jul 30, 1998
Sold by
Sheehan John L and Sheehan Lisa M
Bought by
Strangie Stephan and Strangie Susan
Current Estimated Value
Purchase Details
Closed on
Jun 27, 1995
Sold by
Sullivan Jeffrey P and Sullivan Diane J
Bought by
Sheehan John L and Sheehan Lisa M
Create a Home Valuation Report for This Property
The Home Valuation Report is an in-depth analysis detailing your home's value as well as a comparison with similar homes in the area
Home Values in the Area
Average Home Value in this Area
Purchase History
| Date | Buyer | Sale Price | Title Company |
|---|---|---|---|
| Strangie Stephan | $274,500 | -- | |
| Sheehan John L | $187,000 | -- |
Source: Public Records
Mortgage History
| Date | Status | Borrower | Loan Amount |
|---|---|---|---|
| Open | Sheehan John L | $262,141 | |
| Closed | Sheehan John L | $200,000 |
Source: Public Records
Tax History
| Year | Tax Paid | Tax Assessment Tax Assessment Total Assessment is a certain percentage of the fair market value that is determined by local assessors to be the total taxable value of land and additions on the property. | Land | Improvement |
|---|---|---|---|---|
| 2025 | $7,473 | $699,700 | $325,000 | $374,700 |
| 2024 | $7,190 | $675,100 | $306,500 | $368,600 |
| 2023 | $6,962 | $618,300 | $269,300 | $349,000 |
| 2022 | $6,660 | $554,500 | $247,000 | $307,500 |
| 2021 | $6,441 | $522,000 | $214,500 | $307,500 |
| 2020 | $6,021 | $505,100 | $204,300 | $300,800 |
| 2019 | $5,736 | $470,900 | $185,700 | $285,200 |
| 2018 | $5,338 | $461,000 | $180,200 | $280,800 |
| 2017 | $5,195 | $431,100 | $168,100 | $263,000 |
| 2016 | $5,484 | $449,500 | $167,800 | $281,700 |
| 2015 | $5,146 | $428,100 | $159,800 | $268,300 |
| 2014 | $4,710 | $405,700 | $143,800 | $261,900 |
Source: Public Records
Map
Nearby Homes
Your Personal Tour Guide
Ask me questions while you tour the home.