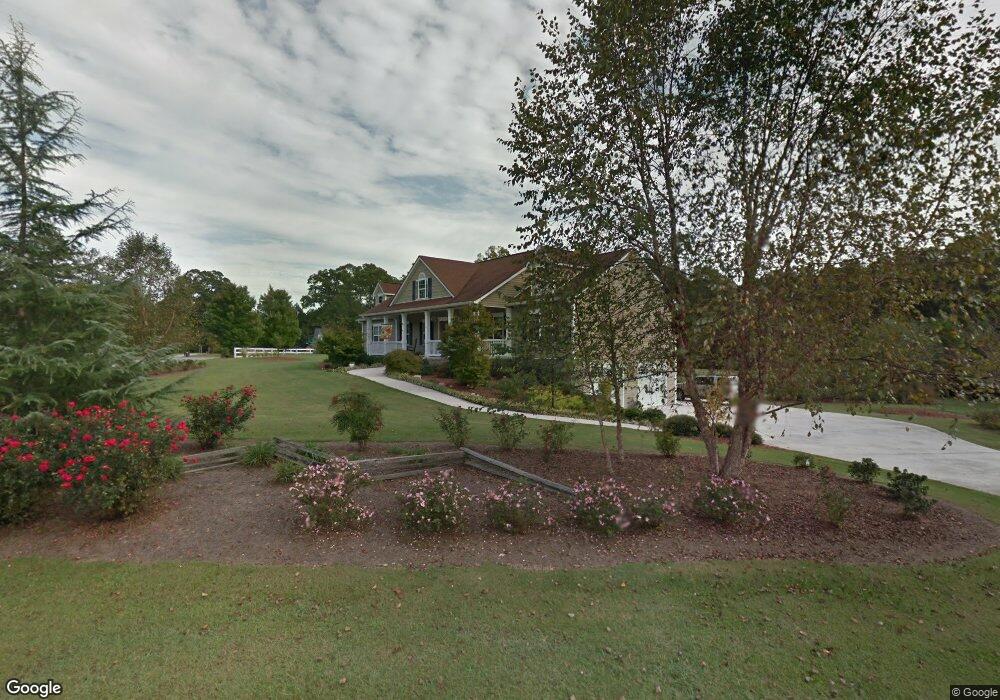
10 Ol Blues Point Newnan, GA 30263
Estimated Value: $472,552 - $599,000
3
Beds
2
Baths
2,220
Sq Ft
$235/Sq Ft
Est. Value
About This Home
This home is located at 10 Ol Blues Point, Newnan, GA 30263 and is currently estimated at $521,638, approximately $234 per square foot. 10 Ol Blues Point is a home located in Coweta County with nearby schools including Ruth Hill Elementary School, Smokey Road Middle School, and Newnan High School.
Ownership History
Date
Name
Owned For
Owner Type
Purchase Details
Closed on
Aug 22, 2012
Sold by
Laster Jerry
Bought by
Laster Jerry and Laster Jacqueline
Current Estimated Value
Home Financials for this Owner
Home Financials are based on the most recent Mortgage that was taken out on this home.
Original Mortgage
$182,014
Outstanding Balance
$121,004
Interest Rate
2.83%
Mortgage Type
New Conventional
Estimated Equity
$400,634
Purchase Details
Closed on
Aug 15, 2005
Sold by
Working Mans Mansions Inc
Bought by
Laster Jerry and Laster Jackie
Home Financials for this Owner
Home Financials are based on the most recent Mortgage that was taken out on this home.
Original Mortgage
$130,000
Interest Rate
5.48%
Mortgage Type
New Conventional
Purchase Details
Closed on
Jul 19, 2004
Sold by
Gmcent Llc
Bought by
Working Mans' Mansions Inc
Purchase Details
Closed on
Nov 27, 2002
Sold by
Witter Derick A
Bought by
Gmcent Llc
Purchase Details
Closed on
Nov 30, 1972
Bought by
Dell William Ross O
Create a Home Valuation Report for This Property
The Home Valuation Report is an in-depth analysis detailing your home's value as well as a comparison with similar homes in the area
Home Values in the Area
Average Home Value in this Area
Purchase History
| Date | Buyer | Sale Price | Title Company |
|---|---|---|---|
| Laster Jerry | -- | -- | |
| Laster Jerry | $245,000 | -- | |
| Working Mans' Mansions Inc | $39,900 | -- | |
| Gmcent Llc | $100,000 | -- | |
| Dell William Ross O | $40,000 | -- |
Source: Public Records
Mortgage History
| Date | Status | Borrower | Loan Amount |
|---|---|---|---|
| Open | Laster Jerry | $182,014 | |
| Previous Owner | Laster Jerry | $130,000 |
Source: Public Records
Tax History Compared to Growth
Tax History
| Year | Tax Paid | Tax Assessment Tax Assessment Total Assessment is a certain percentage of the fair market value that is determined by local assessors to be the total taxable value of land and additions on the property. | Land | Improvement |
|---|---|---|---|---|
| 2024 | $4,526 | $199,550 | $32,000 | $167,550 |
| 2023 | $4,526 | $175,938 | $28,000 | $147,938 |
| 2022 | $3,478 | $145,878 | $28,000 | $117,878 |
| 2021 | $3,155 | $124,513 | $14,000 | $110,513 |
| 2020 | $3,175 | $124,513 | $14,000 | $110,513 |
| 2019 | $2,965 | $106,088 | $18,000 | $88,088 |
| 2018 | $2,970 | $106,088 | $18,000 | $88,088 |
| 2017 | $2,969 | $106,088 | $18,000 | $88,088 |
| 2016 | $2,936 | $106,088 | $18,000 | $88,088 |
| 2015 | $2,889 | $106,088 | $18,000 | $88,088 |
| 2014 | $2,557 | $106,088 | $18,000 | $88,088 |
Source: Public Records
Map
Nearby Homes
- 56 Fox Hollow Run
- 15 Forest Place
- 68 Timberland Trail
- 1845 Smokey Rd
- 50 Hearthstone Dr
- 0 George Arnold Rd Unit 7657652
- 0 George Arnold Rd Unit 10617612
- 713 Smokey Rd
- 150 Wild Boar Way
- 130 Mallard Dr
- 623 Belk Rd
- 0 Walt Sanders Rd Unit 10607560
- 75 Davis McLendon Way
- 0 Meadowsweet Ln Unit 10582479
- 130 Wallace Gray Cir
- 124 Wallace Gray Cir
- 140 Beverly Park Ct
- 31 Festiva Dr
- 0 Wallace Gray Cir Unit 10590659
- 48 Wallace Gray Ct
- 15 Ol Blues Point
- 5 O Dell Ridge
- 15 O Dell Ridge
- 30 Ol Blues Point
- 1384 Smokey Rd
- 25 O Dell Ridge
- 25 Ol Blues Point
- 40 Ol Blues Point
- 40 O Dell Ridge
- 40 O'Dell Ridge
- 35 O'Dell Ridge
- 1405 Smokey Road 0
- 1405 Smokey Rd
- 0 Smokey Rd 0
- 35 O Dell Ridge
- 0 Ol Blues Point Unit 3278131
- 0 Ol Blues Point
- 18 Fox Hollow Run
- 35 Ol Blues Point
- 1277 Smokey Rd