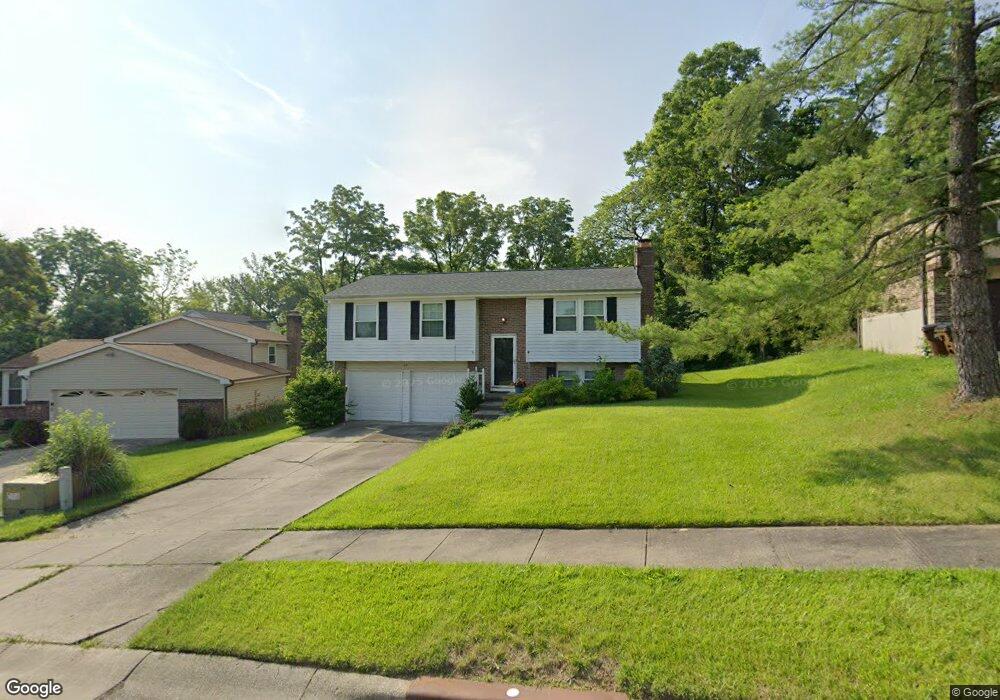
10 Orchard Knoll Dr Cincinnati, OH 45215
Estimated Value: $252,000 - $306,000
3
Beds
2
Baths
1,508
Sq Ft
$185/Sq Ft
Est. Value
About This Home
This home is located at 10 Orchard Knoll Dr, Cincinnati, OH 45215 and is currently estimated at $279,241, approximately $185 per square foot. 10 Orchard Knoll Dr is a home located in Hamilton County with nearby schools including Reading Community High School, Saints Peter and Paul Academy, and Mount Notre Dame High School.
Ownership History
Date
Name
Owned For
Owner Type
Purchase Details
Closed on
Dec 7, 2020
Sold by
Hoyt Dale
Bought by
Hoyt Dale A and Dale Allan Hoyt Trust
Current Estimated Value
Purchase Details
Closed on
Oct 10, 2003
Sold by
Hensley Neal O and Hensley Theresa L
Bought by
Hoyt Dale
Home Financials for this Owner
Home Financials are based on the most recent Mortgage that was taken out on this home.
Original Mortgage
$96,000
Interest Rate
6.49%
Mortgage Type
Unknown
Purchase Details
Closed on
Mar 29, 1996
Sold by
Huff Drees Realty Inc
Bought by
Hensley Neal O and Hensley Theresa L
Home Financials for this Owner
Home Financials are based on the most recent Mortgage that was taken out on this home.
Original Mortgage
$97,350
Interest Rate
7.46%
Mortgage Type
FHA
Purchase Details
Closed on
Feb 29, 1996
Sold by
Bunning James A and Bunning Michele R
Bought by
Huff Drees Realty Inc
Home Financials for this Owner
Home Financials are based on the most recent Mortgage that was taken out on this home.
Original Mortgage
$97,350
Interest Rate
7.46%
Mortgage Type
FHA
Create a Home Valuation Report for This Property
The Home Valuation Report is an in-depth analysis detailing your home's value as well as a comparison with similar homes in the area
Home Values in the Area
Average Home Value in this Area
Purchase History
| Date | Buyer | Sale Price | Title Company |
|---|---|---|---|
| Hoyt Dale A | -- | None Available | |
| Dale Allan Hoyt Trust | $250 | None Listed On Document | |
| Hoyt Dale | $120,000 | Express Title Service | |
| Hensley Neal O | $97,500 | -- | |
| Huff Drees Realty Inc | $101,000 | -- |
Source: Public Records
Mortgage History
| Date | Status | Borrower | Loan Amount |
|---|---|---|---|
| Previous Owner | Hoyt Dale | $96,000 | |
| Previous Owner | Hensley Neal O | $97,350 | |
| Previous Owner | Huff Drees Realty Inc | $86,500 |
Source: Public Records
Tax History Compared to Growth
Tax History
| Year | Tax Paid | Tax Assessment Tax Assessment Total Assessment is a certain percentage of the fair market value that is determined by local assessors to be the total taxable value of land and additions on the property. | Land | Improvement |
|---|---|---|---|---|
| 2024 | $3,483 | $67,281 | $13,965 | $53,316 |
| 2023 | $3,536 | $67,281 | $13,965 | $53,316 |
| 2022 | $3,422 | $50,467 | $11,970 | $38,497 |
| 2021 | $2,856 | $50,467 | $11,970 | $38,497 |
| 2020 | $2,887 | $50,467 | $11,970 | $38,497 |
| 2019 | $2,635 | $42,056 | $9,975 | $32,081 |
| 2018 | $2,638 | $42,056 | $9,975 | $32,081 |
| 2017 | $2,486 | $42,056 | $9,975 | $32,081 |
| 2016 | $2,666 | $45,245 | $10,290 | $34,955 |
| 2015 | $2,690 | $45,245 | $10,290 | $34,955 |
| 2014 | $2,353 | $45,245 | $10,290 | $34,955 |
| 2013 | $2,385 | $46,169 | $10,500 | $35,669 |
Source: Public Records
Map
Nearby Homes
- 2132 Trailridge Dr
- 21 Orchard Knoll Dr
- 234 Mcguire Ln
- 69 Orchard Knoll Dr
- 1955 Hunt Rd
- 796 Kenray Ct
- 310 E Vine St
- 1246 Thurnridge Dr
- 1009 5th St
- 1521 Hunt Rd
- 636 Maple Dr
- 109 Calico Ct
- 515 Maple Dr
- 1626 Krylon Dr
- 0 Hill St Unit 1616370
- 797 4th St
- 8914 Reading Rd
- 18 Gahl Terrace
- 1194 Fuhrman Rd
- 9 W North St
- 6 Orchard Knoll Dr
- 14 Orchard Knoll Dr
- 2 Orchard Knoll Dr
- 2 Orchard Trail
- 18 Orchard Knoll Dr
- 13 Orchard Knoll Dr
- 9 Orchard Knoll Dr
- 532 E Columbia Ave
- 22 Orchard Knoll Dr
- 512 E Columbia Ave
- 5 Orchard Knoll Dr
- 508 E Columbia Ave
- 26 Orchard Knoll Dr
- 540 E Columbia Ave
- 524 E Columbia Ave
- 17 Orchard Knoll Dr
- 1 Orchard Knoll Dr
- 1 Orchard Trail
- 30 Orchard Knoll Dr
- 444 E Columbia Ave