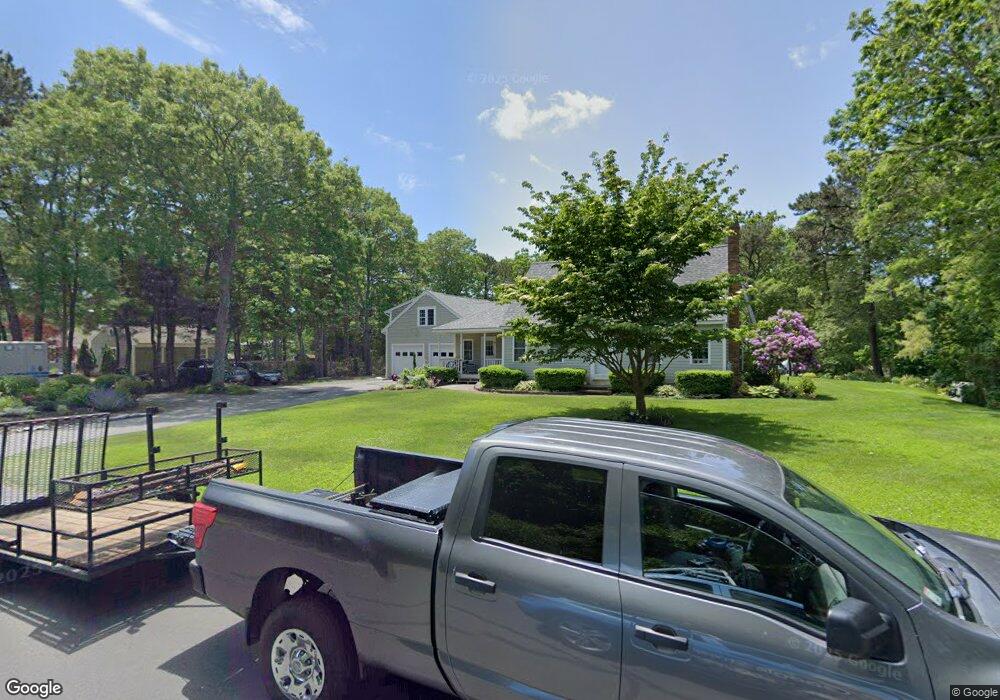
10 Orchard Way Sandwich, MA 02563
Estimated Value: $696,726 - $807,000
3
Beds
2
Baths
2,384
Sq Ft
$321/Sq Ft
Est. Value
About This Home
This home is located at 10 Orchard Way, Sandwich, MA 02563 and is currently estimated at $764,682, approximately $320 per square foot. 10 Orchard Way is a home located in Barnstable County with nearby schools including Sandwich Middle High School, Sandwich Montessori School, and Fair Acres Country Day School.
Ownership History
Date
Name
Owned For
Owner Type
Purchase Details
Closed on
Mar 31, 2025
Sold by
Ferrill Forrest A and Ferrill Diane J
Bought by
Ferrill Protection Ft and Ferrill
Current Estimated Value
Purchase Details
Closed on
Nov 6, 1978
Bought by
Ferrill Forest A and Ferrill Diane J
Create a Home Valuation Report for This Property
The Home Valuation Report is an in-depth analysis detailing your home's value as well as a comparison with similar homes in the area
Home Values in the Area
Average Home Value in this Area
Purchase History
| Date | Buyer | Sale Price | Title Company |
|---|---|---|---|
| Ferrill Protection Ft | -- | None Available | |
| Ferrill Protection Ft | -- | None Available | |
| Ferrill Forest A | -- | -- |
Source: Public Records
Mortgage History
| Date | Status | Borrower | Loan Amount |
|---|---|---|---|
| Previous Owner | Ferrill Forest A | $170,000 | |
| Previous Owner | Ferrill Forest A | $160,000 | |
| Previous Owner | Ferrill Forest A | $149,000 |
Source: Public Records
Tax History Compared to Growth
Tax History
| Year | Tax Paid | Tax Assessment Tax Assessment Total Assessment is a certain percentage of the fair market value that is determined by local assessors to be the total taxable value of land and additions on the property. | Land | Improvement |
|---|---|---|---|---|
| 2025 | $6,080 | $575,200 | $172,000 | $403,200 |
| 2024 | $5,894 | $545,700 | $153,600 | $392,100 |
| 2023 | $5,494 | $477,700 | $139,700 | $338,000 |
| 2022 | $5,228 | $397,300 | $124,700 | $272,600 |
| 2021 | $4,954 | $359,800 | $119,900 | $239,900 |
| 2020 | $4,931 | $344,600 | $117,100 | $227,500 |
| 2019 | $4,614 | $322,200 | $109,200 | $213,000 |
| 2018 | $4,420 | $309,300 | $111,000 | $198,300 |
| 2017 | $4,367 | $292,500 | $107,400 | $185,100 |
| 2016 | $4,146 | $286,500 | $106,300 | $180,200 |
| 2015 | $4,041 | $272,700 | $95,800 | $176,900 |
Source: Public Records
Map
Nearby Homes