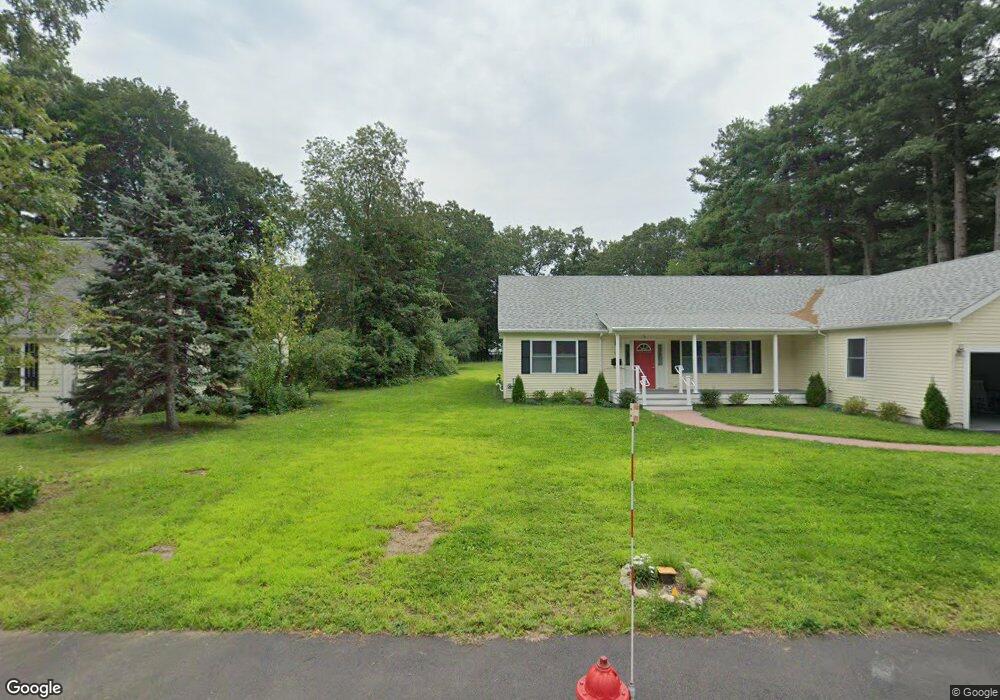
10 Otis St Natick, MA 01760
Estimated Value: $970,000 - $1,156,000
3
Beds
2
Baths
2,048
Sq Ft
$532/Sq Ft
Est. Value
About This Home
This home is located at 10 Otis St, Natick, MA 01760 and is currently estimated at $1,088,985, approximately $531 per square foot. 10 Otis St is a home located in Middlesex County with nearby schools including Natick High School, Bennett-Hemenway (Ben-Hem) Elementary School, and Wilson Middle School.
Ownership History
Date
Name
Owned For
Owner Type
Purchase Details
Closed on
May 27, 2022
Sold by
Scerra William A and Scerra Mary E
Bought by
Scerra Ft
Current Estimated Value
Purchase Details
Closed on
Feb 1, 1982
Bought by
Scerra William A and Scerra Mary E
Create a Home Valuation Report for This Property
The Home Valuation Report is an in-depth analysis detailing your home's value as well as a comparison with similar homes in the area
Home Values in the Area
Average Home Value in this Area
Purchase History
| Date | Buyer | Sale Price | Title Company |
|---|---|---|---|
| Scerra Ft | -- | None Available | |
| Scerra William A | $42,000 | -- |
Source: Public Records
Mortgage History
| Date | Status | Borrower | Loan Amount |
|---|---|---|---|
| Previous Owner | Scerra William A | $133,000 | |
| Previous Owner | Scerra William A | $101,000 | |
| Previous Owner | Scerra William A | $30,000 | |
| Previous Owner | Scerra William A | $60,000 |
Source: Public Records
Tax History
| Year | Tax Paid | Tax Assessment Tax Assessment Total Assessment is a certain percentage of the fair market value that is determined by local assessors to be the total taxable value of land and additions on the property. | Land | Improvement |
|---|---|---|---|---|
| 2025 | $12,536 | $1,048,200 | $464,600 | $583,600 |
| 2024 | $12,065 | $984,100 | $437,200 | $546,900 |
| 2023 | $11,725 | $927,600 | $417,200 | $510,400 |
| 2022 | $6,741 | $505,300 | $376,000 | $129,300 |
| 2021 | $6,484 | $476,400 | $354,500 | $121,900 |
| 2020 | $6,265 | $460,300 | $338,400 | $121,900 |
| 2019 | $5,850 | $460,300 | $338,400 | $121,900 |
| 2018 | $5,356 | $410,400 | $322,300 | $88,100 |
| 2017 | $4,983 | $369,400 | $282,900 | $86,500 |
| 2016 | $4,718 | $347,700 | $261,900 | $85,800 |
| 2015 | $4,708 | $340,700 | $261,900 | $78,800 |
Source: Public Records
Map
Nearby Homes
Your Personal Tour Guide
Ask me questions while you tour the home.