Estimated Value: $471,812 - $525,000
--
Bed
1
Bath
2,441
Sq Ft
$209/Sq Ft
Est. Value
About This Home
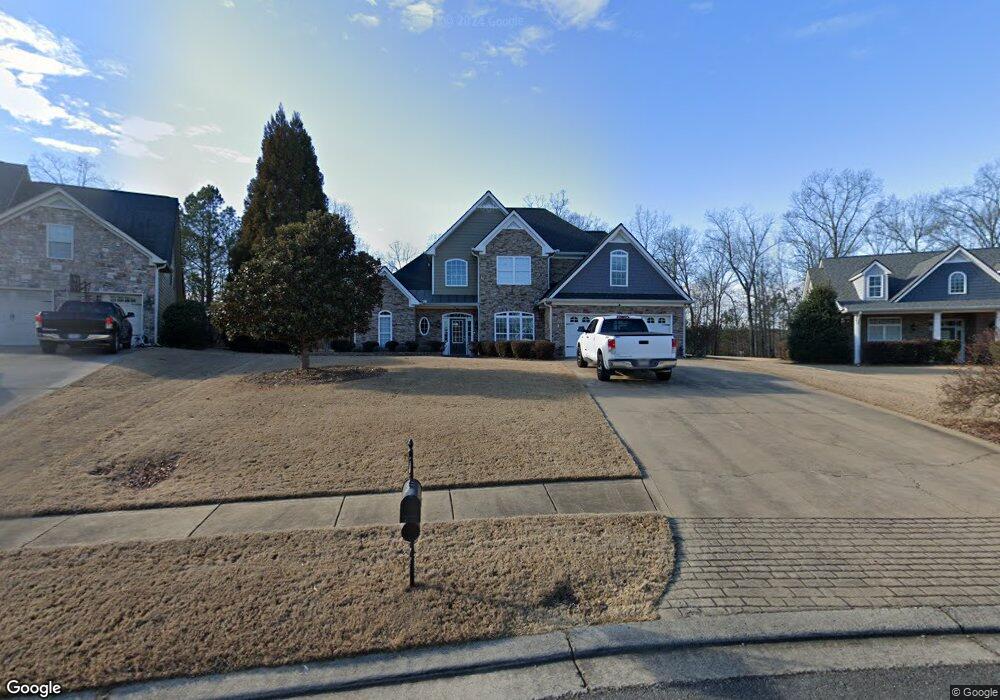
This home is located at 10 Outpost Trail SE, Rome, GA 30161 and is currently estimated at $511,203, approximately $209 per square foot. 10 Outpost Trail SE is a home located in Floyd County with nearby schools including Model Middle School and Model High School.
Ownership History
Date
Name
Owned For
Owner Type
Purchase Details
Closed on
Jan 26, 2009
Sold by
Rush Amanda M
Bought by
Rush Lind
Current Estimated Value
Home Financials for this Owner
Home Financials are based on the most recent Mortgage that was taken out on this home.
Original Mortgage
$301,500
Outstanding Balance
$191,906
Interest Rate
5.23%
Mortgage Type
New Conventional
Estimated Equity
$319,297
Purchase Details
Closed on
Aug 16, 2006
Sold by
Not Provided
Bought by
Rush Lind and Rush Steve L
Purchase Details
Closed on
Apr 12, 2006
Sold by
Not Provided
Bought by
Rush Lind and Rush Steve L
Home Financials for this Owner
Home Financials are based on the most recent Mortgage that was taken out on this home.
Original Mortgage
$227,650
Interest Rate
7.25%
Mortgage Type
New Conventional
Purchase Details
Closed on
Sep 27, 2005
Bought by
P and R
Purchase Details
Closed on
Sep 16, 2005
Sold by
Seven Hills Land Co Inc
Bought by
Eden Custom Homes Inc
Purchase Details
Closed on
Nov 10, 2004
Bought by
Seven Hills Land Company Inc
Create a Home Valuation Report for This Property
The Home Valuation Report is an in-depth analysis detailing your home's value as well as a comparison with similar homes in the area
Home Values in the Area
Average Home Value in this Area
Purchase History
| Date | Buyer | Sale Price | Title Company |
|---|---|---|---|
| Rush Lind | -- | -- | |
| Rush Lind | -- | -- | |
| Rush Lind | -- | -- | |
| Rush Lind | $284,600 | -- | |
| P | $40,000 | -- | |
| Eden Custom Homes Inc | -- | -- | |
| Eden Custom Homes Inc | $42,000 | -- | |
| Seven Hills Land Company Inc | -- | -- |
Source: Public Records
Mortgage History
| Date | Status | Borrower | Loan Amount |
|---|---|---|---|
| Open | Rush Lind | $301,500 | |
| Previous Owner | Rush Lind | $227,650 |
Source: Public Records
Tax History Compared to Growth
Tax History
| Year | Tax Paid | Tax Assessment Tax Assessment Total Assessment is a certain percentage of the fair market value that is determined by local assessors to be the total taxable value of land and additions on the property. | Land | Improvement |
|---|---|---|---|---|
| 2024 | $4,393 | $187,845 | $16,800 | $171,045 |
| 2023 | $4,398 | $182,749 | $16,800 | $165,949 |
| 2022 | $3,823 | $146,123 | $16,000 | $130,123 |
| 2021 | $3,443 | $123,559 | $16,000 | $107,559 |
| 2020 | $3,382 | $118,840 | $16,000 | $102,840 |
| 2019 | $3,177 | $109,891 | $12,000 | $97,891 |
| 2018 | $3,089 | $104,849 | $12,000 | $92,849 |
| 2017 | $2,847 | $96,635 | $8,000 | $88,635 |
| 2016 | $2,838 | $95,192 | $8,000 | $87,192 |
| 2015 | $2,822 | $96,678 | $8,000 | $88,678 |
| 2014 | $2,822 | $96,678 | $8,000 | $88,678 |
Source: Public Records
Map
Nearby Homes
- 3 Outpost Trail SE
- 16 Fallen Branch Cir SE
- 0 Fallen Branch Cir SE Unit 7397536
- 0 Fallen Branch Cir SE Unit 10311756
- 0 Fallen Branch Cir SE Unit 7234792
- 0 Fallen Branch Cir SE Unit 10172755
- 1 Outpost Trail SE
- 0 N Quarters Dr Unit 7467468
- 0 N Quarters Dr Unit 37 10390869
- 21 Everwood Ct SE
- 45 Wildflower Rd NE
- 30 Mountain Creek Dr SE
- 0 Mountain Creek Dr SE Unit 10436191
- 139 Shoals Ferry Rd SE
- 550 Freeman Ferry Rd SE
- 7 Trimble Way SE
- 406 Fred Kelly Rd NE
- 0 Moran Lake Rd NE Unit 10592848
- 0 Moran Lake Rd NE Unit 7639960
- 0 Moran Lake Rd NE Unit 229 10584708
- 8 Outpost Trail SE
- 11 Outpost Trail SE
- 6 Outpost Trail SE Unit 97
- 6 Outpost Trail SE
- 9 Outpost Trail SE
- 7 Outpost Trail SE
- 5 Outpost Trail SE
- 0 Outpost SE Unit 5871826
- 0 Outpost SE Unit 3176620
- 0 Outpost SE Unit TR 9075662
- 0 Outpost SE Unit 7164545
- 0 Outpost SE Unit 7231721
- 0 Outpost SE Unit 7446620
- 35 Fallen Branch Cir SE
- 33 Fallen Branch Cir SE
- 37 Fallen Branch Cir SE
- 5 Fallen Branch Cir SE
- 7 Fallen Branch Cir SE
- 0 Fallen Branch Cir SE Unit 8608811
- 0 Fallen Branch Cir SE Unit 8467973