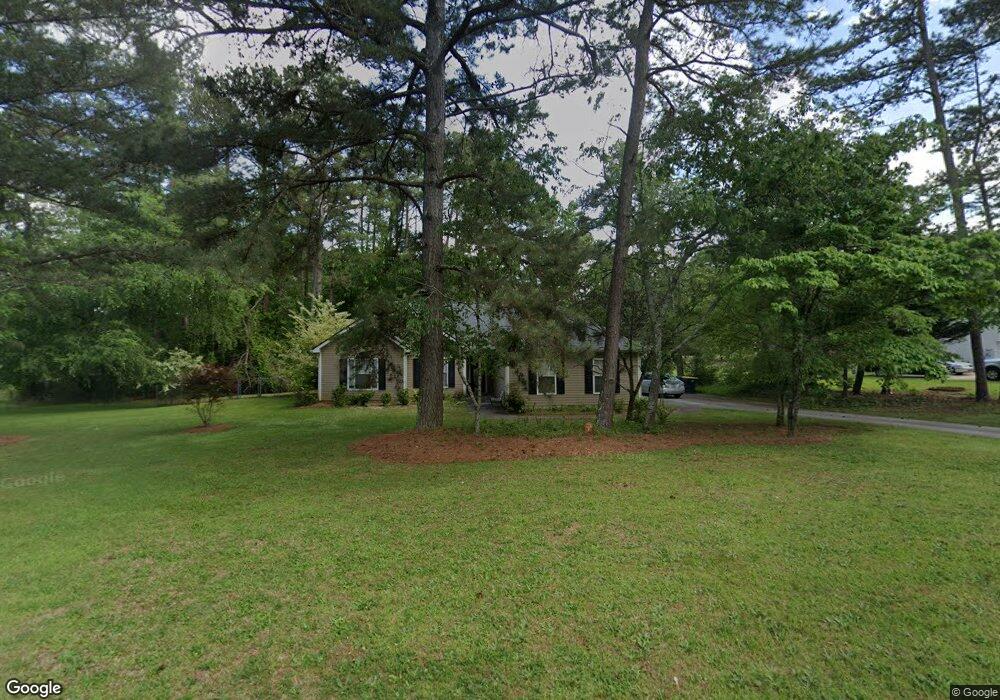
10 Paces Landing Trace Newnan, GA 30263
Estimated Value: $285,087 - $324,000
3
Beds
2
Baths
1,410
Sq Ft
$221/Sq Ft
Est. Value
About This Home
This home is located at 10 Paces Landing Trace, Newnan, GA 30263 and is currently estimated at $312,022, approximately $221 per square foot. 10 Paces Landing Trace is a home located in Coweta County with nearby schools including Brooks Elementary School, Madras Middle School, and Northgate High School.
Ownership History
Date
Name
Owned For
Owner Type
Purchase Details
Closed on
Jun 28, 2001
Sold by
Johnson Marcellous and Johnson Vanessa
Bought by
Campbell Susan B
Current Estimated Value
Home Financials for this Owner
Home Financials are based on the most recent Mortgage that was taken out on this home.
Original Mortgage
$117,300
Outstanding Balance
$44,156
Interest Rate
7.14%
Mortgage Type
New Conventional
Estimated Equity
$267,866
Purchase Details
Closed on
Mar 26, 1998
Sold by
D & S Homes
Bought by
Johnson Marcellous and Johnson Vanessa
Home Financials for this Owner
Home Financials are based on the most recent Mortgage that was taken out on this home.
Original Mortgage
$100,562
Interest Rate
6.95%
Mortgage Type
FHA
Purchase Details
Closed on
Mar 11, 1997
Bought by
D & S Homes Inc
Purchase Details
Closed on
Jan 25, 1996
Bought by
Evergreen Communitie
Purchase Details
Closed on
Jul 31, 1978
Bought by
Francavilla Carl and Francavilla J
Create a Home Valuation Report for This Property
The Home Valuation Report is an in-depth analysis detailing your home's value as well as a comparison with similar homes in the area
Home Values in the Area
Average Home Value in this Area
Purchase History
| Date | Buyer | Sale Price | Title Company |
|---|---|---|---|
| Campbell Susan B | $127,900 | -- | |
| Johnson Marcellous | $103,000 | -- | |
| D & S Homes Inc | $71,600 | -- | |
| Evergreen Communitie | $196,500 | -- | |
| Francavilla Carl | -- | -- |
Source: Public Records
Mortgage History
| Date | Status | Borrower | Loan Amount |
|---|---|---|---|
| Open | Campbell Susan B | $117,300 | |
| Previous Owner | Johnson Marcellous | $100,562 |
Source: Public Records
Tax History Compared to Growth
Tax History
| Year | Tax Paid | Tax Assessment Tax Assessment Total Assessment is a certain percentage of the fair market value that is determined by local assessors to be the total taxable value of land and additions on the property. | Land | Improvement |
|---|---|---|---|---|
| 2025 | $1,214 | $110,480 | $22,000 | $88,480 |
| 2024 | $1,077 | $106,095 | $22,000 | $84,095 |
| 2023 | $1,077 | $98,462 | $22,000 | $76,462 |
| 2022 | $2,110 | $85,673 | $22,000 | $63,673 |
| 2021 | $1,776 | $67,472 | $18,000 | $49,472 |
| 2020 | $1,788 | $67,472 | $18,000 | $49,472 |
| 2019 | $1,813 | $61,950 | $10,000 | $51,950 |
| 2018 | $1,816 | $61,950 | $10,000 | $51,950 |
| 2017 | $1,740 | $59,352 | $10,000 | $49,352 |
| 2016 | $1,579 | $54,528 | $10,000 | $44,528 |
| 2015 | $1,500 | $52,673 | $10,000 | $42,673 |
| 2014 | $1,232 | $46,962 | $8,000 | $38,962 |
Source: Public Records
Map
Nearby Homes
- 73 Elys Ridge
- 8 Ranan Ln
- 135 Ashley Creek Dr
- 140 S Alexander Creek Rd
- 40 Paces Landing Trail
- 337 Atlantica Dr Unit 75
- 12 Conifer Ct Unit 67
- 280 Atlantica Dr Unit 45
- 360 Atlantica Dr Unit 51
- 91 Cedara Dr Unit 91
- 82 Atlantica Dr Unit 26
- 76 Atlantica Dr
- 380 Atlantica Dr Unit 52
- 127 Atlantica Dr Unit 86
- 188 Atlantica Dr Unit 34
- 162 Atlantica Dr Unit 32
- 16 Enclave Ln
- 439 Lamar Smith Dr Unit LOT 4
- 394 S Alexander Creek Rd
- 200 Timberidge Dr
- 20 Paces Landing Trace
- 139 Paces Landing Dr
- 9 Paces Landing Trace
- 23 Paces Landing Trace
- 129 Paces Landing Dr
- 40 Paces Landing Trace
- 29 Paces Landing Trace
- 157 Paces Landing Dr
- 138 Paces Landing Dr
- 119 Paces Landing Dr
- 39 Paces Landing Trace
- 126 Paces Landing Dr
- 10 Ashley Creek Dr
- 64 Paces Landing Trace
- 105 Paces Landing Dr
- 55 Paces Landing Trace
- 20 Ashley Creek Dr
- 7 Paces Landing Way
- 93 Paces Landing Dr
- 30 Ashley Creek Dr