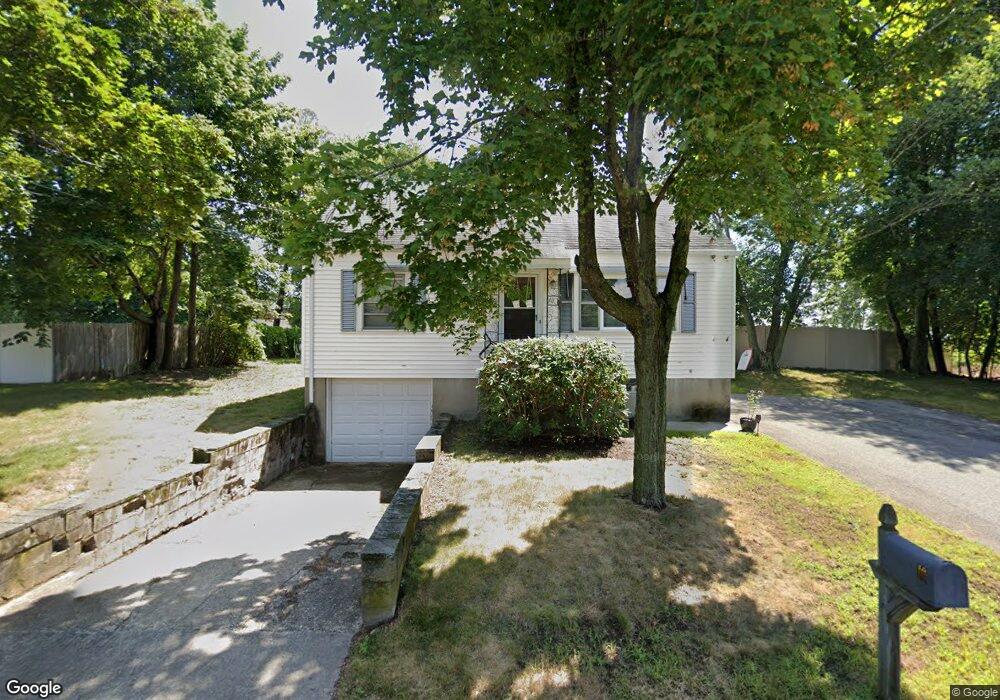
10 Park Ave Middleton, MA 01949
Estimated Value: $629,000 - $818,000
4
Beds
2
Baths
1,459
Sq Ft
$479/Sq Ft
Est. Value
About This Home
This home is located at 10 Park Ave, Middleton, MA 01949 and is currently estimated at $699,232, approximately $479 per square foot. 10 Park Ave is a home located in Essex County with nearby schools including Howe-Manning Elementary School, Fuller Meadow Elementary School, and Masconomet Regional Middle School.
Ownership History
Date
Name
Owned For
Owner Type
Purchase Details
Closed on
Oct 21, 2014
Sold by
Blais James
Bought by
Jdblais Ft and Blais
Current Estimated Value
Purchase Details
Closed on
Jan 7, 2011
Sold by
Deutsche Bank Natl T C
Bought by
Blais James
Purchase Details
Closed on
May 21, 2010
Sold by
Grace Selwyn F
Bought by
Deutsche Bank Natl T C
Create a Home Valuation Report for This Property
The Home Valuation Report is an in-depth analysis detailing your home's value as well as a comparison with similar homes in the area
Home Values in the Area
Average Home Value in this Area
Purchase History
| Date | Buyer | Sale Price | Title Company |
|---|---|---|---|
| Jdblais Ft | -- | -- | |
| Jdblais Ft | -- | -- | |
| Blais James | $175,000 | -- | |
| Blais James | $175,000 | -- | |
| Deutsche Bank Natl T C | $199,000 | -- | |
| Deutsche Bank Natl T C | $199,000 | -- |
Source: Public Records
Mortgage History
| Date | Status | Borrower | Loan Amount |
|---|---|---|---|
| Previous Owner | Deutsche Bank Natl T C | $165,000 | |
| Previous Owner | Deutsche Bank Natl T C | $265,500 |
Source: Public Records
Tax History Compared to Growth
Tax History
| Year | Tax Paid | Tax Assessment Tax Assessment Total Assessment is a certain percentage of the fair market value that is determined by local assessors to be the total taxable value of land and additions on the property. | Land | Improvement |
|---|---|---|---|---|
| 2025 | $6,507 | $547,300 | $270,100 | $277,200 |
| 2024 | $6,663 | $565,100 | $270,100 | $295,000 |
| 2023 | $6,248 | $485,500 | $284,000 | $201,500 |
| 2022 | $5,729 | $432,400 | $243,900 | $188,500 |
| 2021 | $5,617 | $409,400 | $234,100 | $175,300 |
| 2020 | $5,478 | $402,200 | $228,700 | $173,500 |
| 2019 | $5,590 | $408,300 | $228,700 | $179,600 |
| 2018 | $5,178 | $370,900 | $207,900 | $163,000 |
| 2017 | $4,652 | $333,500 | $180,500 | $153,000 |
| 2016 | $4,471 | $321,900 | $180,500 | $141,400 |
| 2015 | -- | $327,600 | $194,900 | $132,700 |
Source: Public Records
Map
Nearby Homes