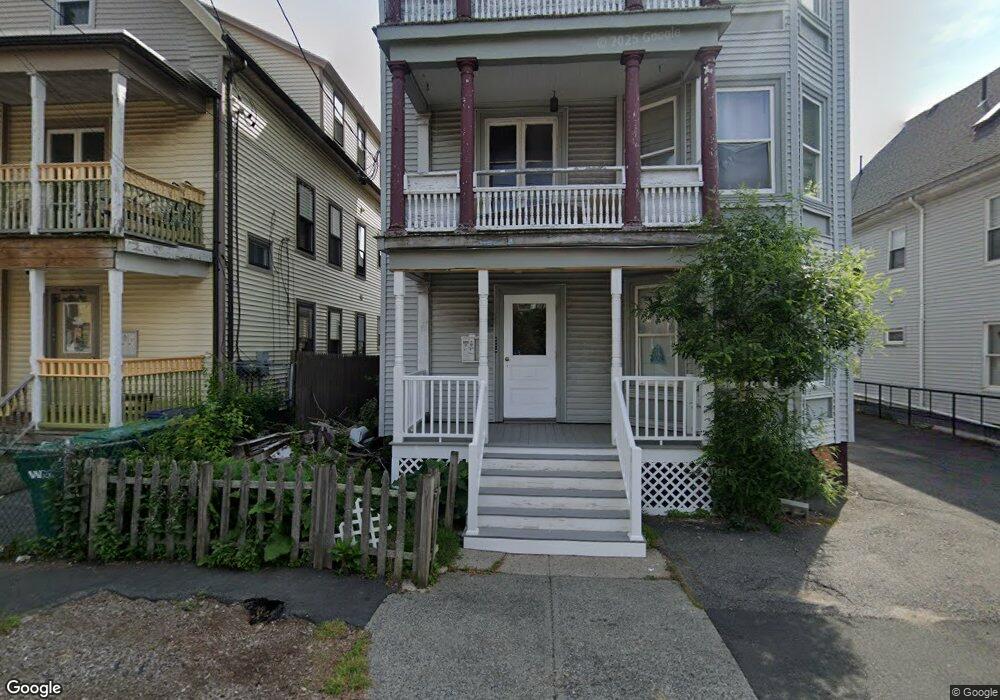
10 Parker Ave Unit 12 Lynn, MA 01902
Diamond District NeighborhoodEstimated Value: $920,000 - $1,179,000
9
Beds
3
Baths
4,377
Sq Ft
$227/Sq Ft
Est. Value
About This Home
This home is located at 10 Parker Ave Unit 12, Lynn, MA 01902 and is currently estimated at $992,578, approximately $226 per square foot. 10 Parker Ave Unit 12 is a home located in Essex County with nearby schools including Brickett Elementary School, William R. Fallon School, and Marshall Middle School.
Ownership History
Date
Name
Owned For
Owner Type
Purchase Details
Closed on
Oct 18, 2011
Sold by
Bonbon Marion and Bonbon Raoul
Bought by
Bonbon Marion
Current Estimated Value
Purchase Details
Closed on
Nov 15, 2005
Sold by
D S Rt and Skalkos George
Bought by
Bonbon Raoul and Bonbon Marian
Home Financials for this Owner
Home Financials are based on the most recent Mortgage that was taken out on this home.
Original Mortgage
$382,400
Interest Rate
5.93%
Mortgage Type
Purchase Money Mortgage
Purchase Details
Closed on
Dec 11, 1996
Sold by
Skalkos Demetrois and Eastern Sb
Bought by
Skalkos George A
Purchase Details
Closed on
Sep 21, 1989
Sold by
Wills Matthews
Bought by
Skalkos Demetrios
Create a Home Valuation Report for This Property
The Home Valuation Report is an in-depth analysis detailing your home's value as well as a comparison with similar homes in the area
Home Values in the Area
Average Home Value in this Area
Purchase History
| Date | Buyer | Sale Price | Title Company |
|---|---|---|---|
| Bonbon Marion | -- | -- | |
| Bonbon Marion | -- | -- | |
| Bonbon Raoul | $478,000 | -- | |
| Bonbon Raoul | $478,000 | -- | |
| Skalkos George A | $110,000 | -- | |
| Skalkos George A | $110,000 | -- | |
| Skalkos Demetrios | $155,000 | -- | |
| Skalkos Demetrios | $155,000 | -- |
Source: Public Records
Mortgage History
| Date | Status | Borrower | Loan Amount |
|---|---|---|---|
| Previous Owner | Skalkos Demetrios | $382,400 |
Source: Public Records
Tax History Compared to Growth
Tax History
| Year | Tax Paid | Tax Assessment Tax Assessment Total Assessment is a certain percentage of the fair market value that is determined by local assessors to be the total taxable value of land and additions on the property. | Land | Improvement |
|---|---|---|---|---|
| 2025 | $9,708 | $937,100 | $192,200 | $744,900 |
| 2024 | $9,691 | $920,300 | $183,800 | $736,500 |
| 2023 | $9,503 | $852,300 | $196,600 | $655,700 |
| 2022 | $9,173 | $738,000 | $153,500 | $584,500 |
| 2021 | $8,553 | $656,400 | $125,800 | $530,600 |
| 2020 | $8,250 | $615,700 | $129,300 | $486,400 |
| 2019 | $7,702 | $538,600 | $99,800 | $438,800 |
| 2018 | $7,299 | $481,800 | $112,100 | $369,700 |
| 2017 | $6,965 | $446,500 | $98,500 | $348,000 |
| 2016 | $6,336 | $391,600 | $82,200 | $309,400 |
| 2015 | $5,854 | $349,500 | $87,100 | $262,400 |
Source: Public Records
Map
Nearby Homes
- 24 Parrott St
- 129 Williams Ave
- 38 Chestnut St
- 26 Groveland St
- 248 Essex St
- 38 Cherry St Unit 1
- 46 Wardwell Ave
- 42 Basset St
- 175 Essex St
- 13 Portland St Unit 4
- 2 Peirce Rd
- 14-16 Dexter St
- 35 Columbia Ave
- 14 Jewetts Ct
- 344 Essex St
- 12 Chestnut Ave
- 133 Eastern Ave Unit 8
- 42 Joyce St Unit H
- 30 Clifton Ave
- 249 Chatham St
- 8 Parker Ave
- 16 Parker Ave
- 20 Parker Ave Unit 2
- 20 Parker Ave
- 62 Autumn St
- 58 Autumn St
- 26 Bloomfield St
- 20 Bloomfield St
- 79 Parker Ave
- 54 Autumn St
- 14 Bloomfield St
- 5 Parker Ave
- 5 Parker Ave Unit 1
- 50 Autumn St
- 36 Bloomfield St
- 17 Stephen St
- 13 Stephen St
- 13 Stephen St Unit 1
- 13 Stephen St Unit 2
- 9 Stephen St