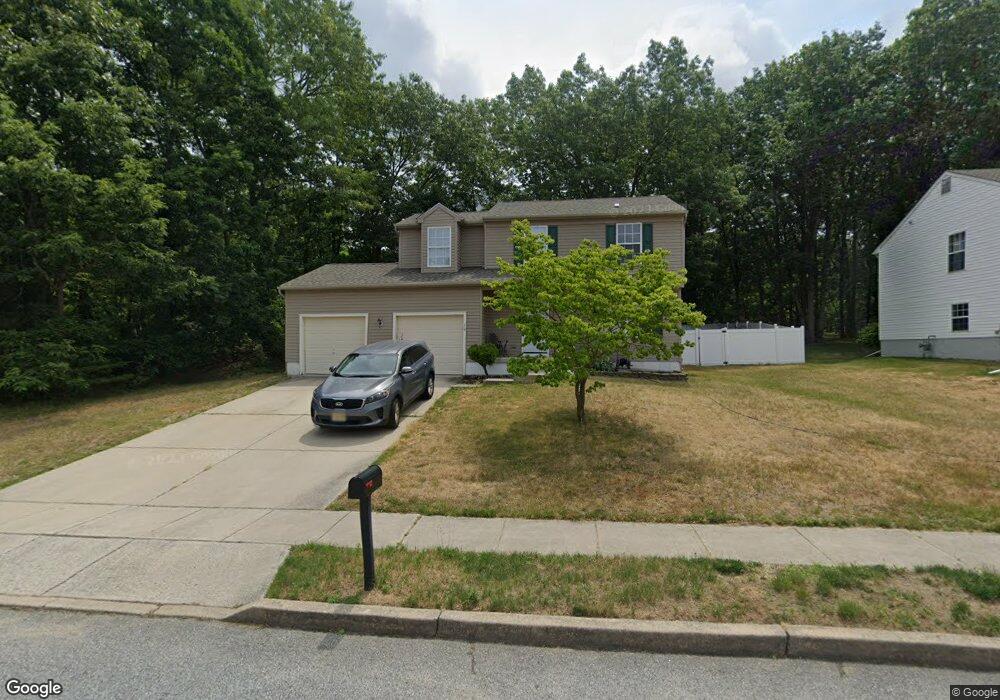
10 Parsons Ct Sicklerville, NJ 08081
Erial NeighborhoodEstimated Value: $362,130 - $459,000
--
Bed
--
Bath
1,796
Sq Ft
$227/Sq Ft
Est. Value
About This Home
This home is located at 10 Parsons Ct, Sicklerville, NJ 08081 and is currently estimated at $407,533, approximately $226 per square foot. 10 Parsons Ct is a home located in Camden County with nearby schools including James W. Lilley Elementary School, Timber Creek High School, and Erial Community Church Christian School.
Ownership History
Date
Name
Owned For
Owner Type
Purchase Details
Closed on
Apr 1, 1997
Sold by
Mipro Homes Llc
Bought by
Henry Sonya M
Current Estimated Value
Home Financials for this Owner
Home Financials are based on the most recent Mortgage that was taken out on this home.
Original Mortgage
$122,000
Outstanding Balance
$15,595
Interest Rate
7.76%
Mortgage Type
FHA
Estimated Equity
$391,938
Create a Home Valuation Report for This Property
The Home Valuation Report is an in-depth analysis detailing your home's value as well as a comparison with similar homes in the area
Home Values in the Area
Average Home Value in this Area
Purchase History
| Date | Buyer | Sale Price | Title Company |
|---|---|---|---|
| Henry Sonya M | $122,800 | -- |
Source: Public Records
Mortgage History
| Date | Status | Borrower | Loan Amount |
|---|---|---|---|
| Open | Henry Sonya M | $122,000 |
Source: Public Records
Tax History Compared to Growth
Tax History
| Year | Tax Paid | Tax Assessment Tax Assessment Total Assessment is a certain percentage of the fair market value that is determined by local assessors to be the total taxable value of land and additions on the property. | Land | Improvement |
|---|---|---|---|---|
| 2025 | $9,334 | $218,600 | $71,600 | $147,000 |
| 2024 | $9,076 | $218,600 | $71,600 | $147,000 |
| 2023 | $9,076 | $218,600 | $71,600 | $147,000 |
| 2022 | $9,019 | $218,600 | $71,600 | $147,000 |
| 2021 | $8,821 | $218,600 | $71,600 | $147,000 |
| 2020 | $8,814 | $218,600 | $71,600 | $147,000 |
| 2019 | $8,633 | $218,600 | $71,600 | $147,000 |
| 2018 | $8,600 | $218,600 | $71,600 | $147,000 |
| 2017 | $8,322 | $218,600 | $71,600 | $147,000 |
| 2016 | $8,143 | $218,600 | $71,600 | $147,000 |
| 2015 | $7,561 | $218,600 | $71,600 | $147,000 |
| 2014 | $7,511 | $218,600 | $71,600 | $147,000 |
Source: Public Records
Map
Nearby Homes