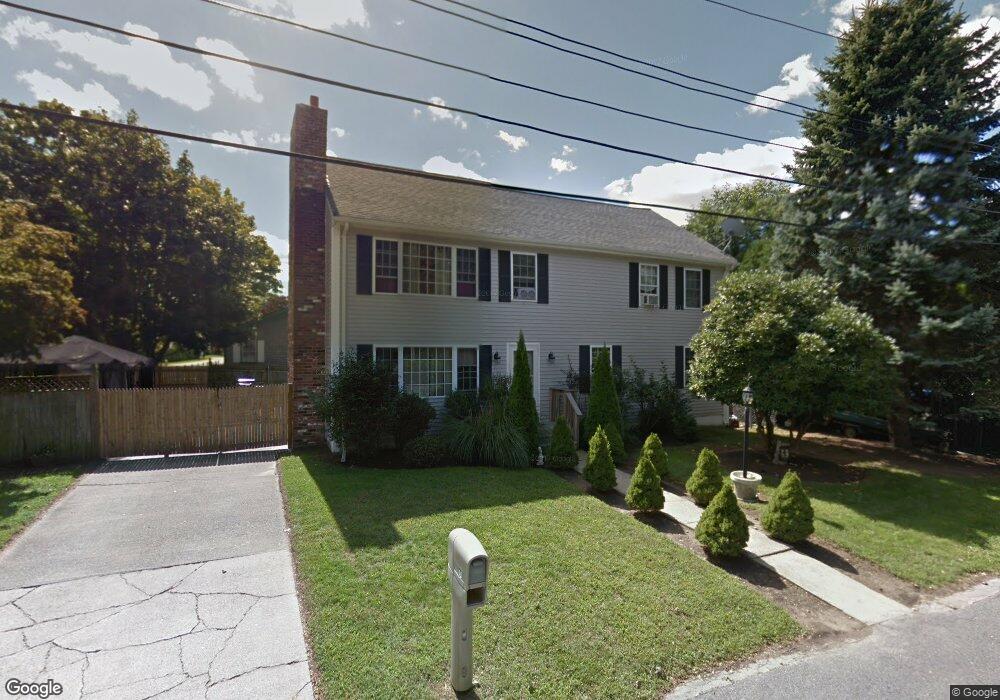
10 Paulette St Acushnet, MA 02743
Upper Acushnet NeighborhoodEstimated Value: $489,658 - $680,000
2
Beds
2
Baths
3,146
Sq Ft
$173/Sq Ft
Est. Value
About This Home
This home is located at 10 Paulette St, Acushnet, MA 02743 and is currently estimated at $544,665, approximately $173 per square foot. 10 Paulette St is a home located in Bristol County with nearby schools including Acushnet Elementary School, Albert F Ford Middle School, and Alma Del Mar Charter School.
Ownership History
Date
Name
Owned For
Owner Type
Purchase Details
Closed on
Jan 26, 2005
Sold by
Ben-David Shelly M and Manning Shelly
Bought by
Ben-David Shelly M
Current Estimated Value
Home Financials for this Owner
Home Financials are based on the most recent Mortgage that was taken out on this home.
Original Mortgage
$251,000
Interest Rate
5.67%
Mortgage Type
Purchase Money Mortgage
Purchase Details
Closed on
Feb 28, 1994
Sold by
Rei Donald G and Rei Fernanda
Bought by
David Ronnie Ben and David Shelley M
Purchase Details
Closed on
Feb 13, 1987
Sold by
Castelo Jose S
Bought by
Rei Donald G
Create a Home Valuation Report for This Property
The Home Valuation Report is an in-depth analysis detailing your home's value as well as a comparison with similar homes in the area
Home Values in the Area
Average Home Value in this Area
Purchase History
| Date | Buyer | Sale Price | Title Company |
|---|---|---|---|
| Ben-David Shelly M | -- | -- | |
| David Ronnie Ben | $128,000 | -- | |
| Rei Donald G | $129,000 | -- |
Source: Public Records
Mortgage History
| Date | Status | Borrower | Loan Amount |
|---|---|---|---|
| Open | Rei Donald G | $44,000 | |
| Open | Rei Donald G | $266,500 | |
| Closed | Rei Donald G | $251,000 |
Source: Public Records
Tax History Compared to Growth
Tax History
| Year | Tax Paid | Tax Assessment Tax Assessment Total Assessment is a certain percentage of the fair market value that is determined by local assessors to be the total taxable value of land and additions on the property. | Land | Improvement |
|---|---|---|---|---|
| 2025 | $46 | $429,300 | $119,100 | $310,200 |
| 2024 | $4,468 | $391,600 | $112,900 | $278,700 |
| 2023 | $4,486 | $373,800 | $102,400 | $271,400 |
| 2022 | $4,424 | $333,400 | $96,100 | $237,300 |
| 2021 | $4,047 | $292,600 | $96,100 | $196,500 |
| 2020 | $3,992 | $286,400 | $89,900 | $196,500 |
| 2019 | $3,780 | $266,600 | $85,700 | $180,900 |
| 2018 | $3,648 | $253,000 | $85,700 | $167,300 |
| 2017 | $3,548 | $245,700 | $85,700 | $160,000 |
| 2016 | $3,570 | $245,700 | $85,700 | $160,000 |
| 2015 | $3,266 | $228,700 | $85,700 | $143,000 |
Source: Public Records
Map
Nearby Homes