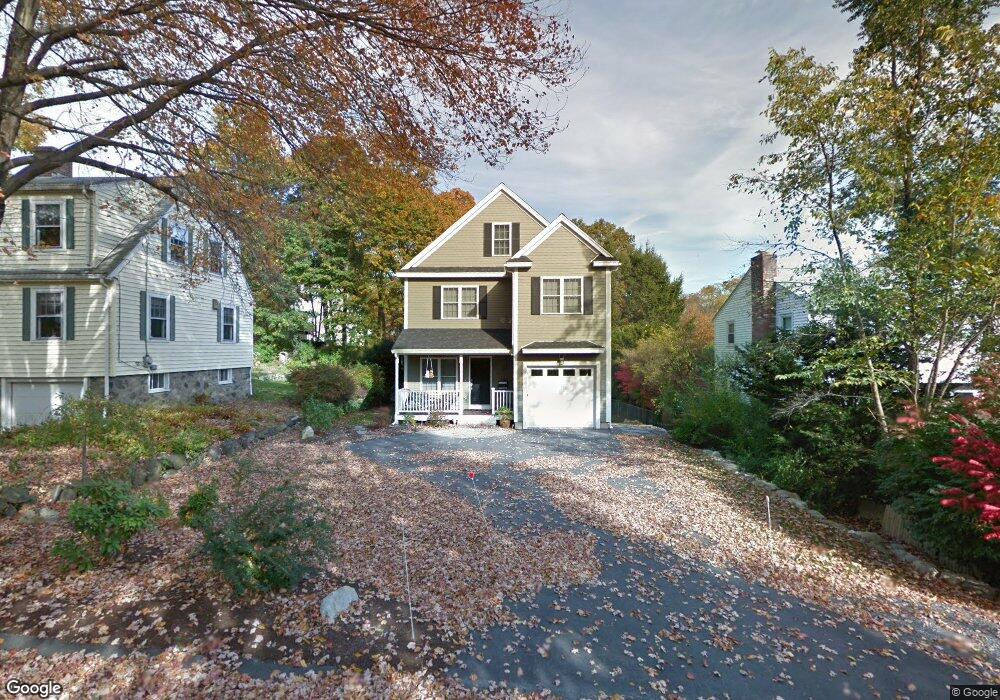
10 Payson St Lexington, MA 02421
Idylwilde NeighborhoodEstimated Value: $1,800,989 - $2,546,000
4
Beds
3
Baths
3,305
Sq Ft
$641/Sq Ft
Est. Value
About This Home
This home is located at 10 Payson St, Lexington, MA 02421 and is currently estimated at $2,117,747, approximately $640 per square foot. 10 Payson St is a home located in Middlesex County with nearby schools including Bridge Elementary School, Jonas Clarke Middle School, and Lexington High School.
Ownership History
Date
Name
Owned For
Owner Type
Purchase Details
Closed on
Jun 2, 2015
Sold by
Tan Eugene and Tan Mary L
Bought by
Eugene Bacorro Ret
Current Estimated Value
Purchase Details
Closed on
Apr 4, 2011
Sold by
Berglund Ent Inc
Bought by
Bacorro Eugene A and Tan Mary A L
Home Financials for this Owner
Home Financials are based on the most recent Mortgage that was taken out on this home.
Original Mortgage
$762,080
Interest Rate
5.04%
Mortgage Type
Purchase Money Mortgage
Purchase Details
Closed on
Aug 25, 2010
Sold by
Beinar Mary E
Bought by
Berglund Enterprises I
Home Financials for this Owner
Home Financials are based on the most recent Mortgage that was taken out on this home.
Original Mortgage
$600,000
Interest Rate
4.57%
Mortgage Type
Purchase Money Mortgage
Create a Home Valuation Report for This Property
The Home Valuation Report is an in-depth analysis detailing your home's value as well as a comparison with similar homes in the area
Home Values in the Area
Average Home Value in this Area
Purchase History
We collect this data history from publicly available records. To have your information removed, we recommend requesting removal directly through your county’s website.
| Date | Buyer | Sale Price | Title Company |
|---|---|---|---|
| Eugene Bacorro Ret | -- | -- | |
| Bacorro Eugene A | $952,600 | -- | |
| Berglund Enterprises I | $350,000 | -- | |
| Berglund Enterprises I | $350,000 | -- |
Source: Public Records
Mortgage History
We collect this data history from publicly available records. To have your information removed, we recommend requesting removal directly through your county’s website.
| Date | Status | Borrower | Loan Amount |
|---|---|---|---|
| Previous Owner | Bacorro Eugene A | $762,080 | |
| Previous Owner | Berglund Enterprises I | $600,000 |
Source: Public Records
Tax History
| Year | Tax Paid | Tax Assessment Tax Assessment Total Assessment is a certain percentage of the fair market value that is determined by local assessors to be the total taxable value of land and additions on the property. | Land | Improvement |
|---|---|---|---|---|
| 2025 | $19,348 | $1,582,000 | $827,000 | $755,000 |
| 2024 | $18,583 | $1,517,000 | $787,000 | $730,000 |
| 2023 | $17,563 | $1,351,000 | $716,000 | $635,000 |
| 2022 | $17,057 | $1,236,000 | $651,000 | $585,000 |
| 2021 | $16,808 | $1,168,000 | $593,000 | $575,000 |
| 2020 | $15,806 | $1,125,000 | $593,000 | $532,000 |
| 2019 | $15,377 | $1,089,000 | $565,000 | $524,000 |
| 2018 | $14,872 | $1,040,000 | $538,000 | $502,000 |
| 2017 | $15,693 | $1,083,000 | $572,000 | $511,000 |
| 2016 | $15,491 | $1,061,000 | $545,000 | $516,000 |
| 2015 | $14,979 | $1,008,000 | $495,000 | $513,000 |
| 2014 | -- | $905,000 | $357,000 | $548,000 |
Source: Public Records
Map
Nearby Homes
- 29 Bridge St
- 383 Marrett Rd
- 17 Prospect Hill Rd
- 14 Normandy Rd
- 1 Munroe Rd
- 24 Normandy Rd
- 70 Spring St
- 6 Brookside Ave
- 22 Fairbanks Rd
- 3 Effie Place
- 9 Woodcliffe Rd
- 232 Lincoln St
- 65 Sherburne Rd S
- 15 John Poulter Rd
- 8 Common Ct
- 8 Common Ct Unit 8
- 20 Common Ct Unit 20
- 19 Deering Ave
- 780 Waltham St
- 209 Waltham St
Your Personal Tour Guide
Ask me questions while you tour the home.