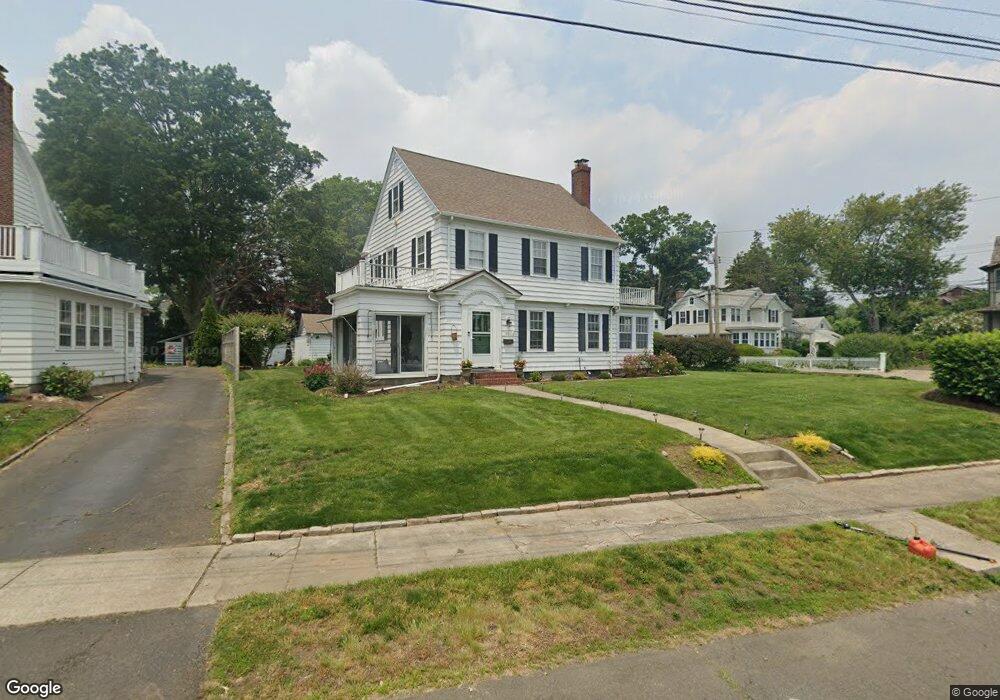
10 Penfield Place Bridgeport, CT 06605
Black Rock NeighborhoodEstimated Value: $743,351 - $896,000
3
Beds
3
Baths
1,830
Sq Ft
$437/Sq Ft
Est. Value
About This Home
This home is located at 10 Penfield Place, Bridgeport, CT 06605 and is currently estimated at $800,588, approximately $437 per square foot. 10 Penfield Place is a home located in Fairfield County with nearby schools including Black Rock School, Bassick High School, and Park City Prep Charter School.
Ownership History
Date
Name
Owned For
Owner Type
Purchase Details
Closed on
Feb 2, 2021
Sold by
Tyliszczak Stephen and Tyliszczaz Susan
Bought by
Smeltz Sabrina
Current Estimated Value
Home Financials for this Owner
Home Financials are based on the most recent Mortgage that was taken out on this home.
Original Mortgage
$463,980
Outstanding Balance
$414,979
Interest Rate
2.7%
Mortgage Type
Purchase Money Mortgage
Estimated Equity
$385,609
Purchase Details
Closed on
May 26, 1998
Sold by
Donnelly Margaret M
Bought by
Tylszczak Stephen J and Tylcszczak Susan B
Home Financials for this Owner
Home Financials are based on the most recent Mortgage that was taken out on this home.
Original Mortgage
$140,000
Interest Rate
7.03%
Mortgage Type
Unknown
Create a Home Valuation Report for This Property
The Home Valuation Report is an in-depth analysis detailing your home's value as well as a comparison with similar homes in the area
Home Values in the Area
Average Home Value in this Area
Purchase History
| Date | Buyer | Sale Price | Title Company |
|---|---|---|---|
| Smeltz Sabrina | $480,000 | None Available | |
| Smeltz Sabrina | $480,000 | None Available | |
| Tylszczak Stephen J | $175,000 | -- | |
| Tylszczak Stephen J | $175,000 | -- |
Source: Public Records
Mortgage History
| Date | Status | Borrower | Loan Amount |
|---|---|---|---|
| Open | Smeltz Sabrina | $463,980 | |
| Closed | Smeltz Sabrina | $463,980 | |
| Previous Owner | Tylszczak Stephen J | $40,000 | |
| Previous Owner | Tylszczak Stephen J | $140,000 |
Source: Public Records
Tax History Compared to Growth
Tax History
| Year | Tax Paid | Tax Assessment Tax Assessment Total Assessment is a certain percentage of the fair market value that is determined by local assessors to be the total taxable value of land and additions on the property. | Land | Improvement |
|---|---|---|---|---|
| 2025 | $13,083 | $301,100 | $158,070 | $143,030 |
| 2024 | $12,009 | $276,390 | $158,070 | $118,320 |
| 2023 | $12,009 | $276,390 | $158,070 | $118,320 |
| 2022 | $12,009 | $276,390 | $158,070 | $118,320 |
| 2021 | $12,009 | $276,390 | $158,070 | $118,320 |
| 2020 | $14,957 | $277,037 | $201,521 | $75,516 |
| 2019 | $14,957 | $277,037 | $201,521 | $75,516 |
| 2018 | $15,063 | $277,037 | $201,521 | $75,516 |
| 2017 | $15,063 | $277,037 | $201,521 | $75,516 |
| 2016 | $18,828 | $346,300 | $251,900 | $94,400 |
| 2015 | $16,036 | $380,000 | $201,100 | $178,900 |
| 2014 | $16,036 | $380,000 | $201,100 | $178,900 |
Source: Public Records
Map
Nearby Homes
- 317 Brewster St
- 75 Homestead Ave Unit 77
- 554 Brewster St Unit 4
- 39 Jetland Place Unit 41
- 26 Rowsley St Unit 3
- 37 Rowsley St Unit 6
- 105 Fox St Unit 107
- 165 Bennett St
- 166 Alfred St
- 855 Brewster St Unit 857
- 0 Battery Park Dr
- 188 Monroe St Unit 190
- 167 Scofield Ave
- 361 Riverside Dr
- 82 Waldorf Ave
- 25 Whittier St
- 31 Whittier St
- 2180 Kings Hwy Unit 1
- 130 Brentwood Ave
- 118 Berwick Ave