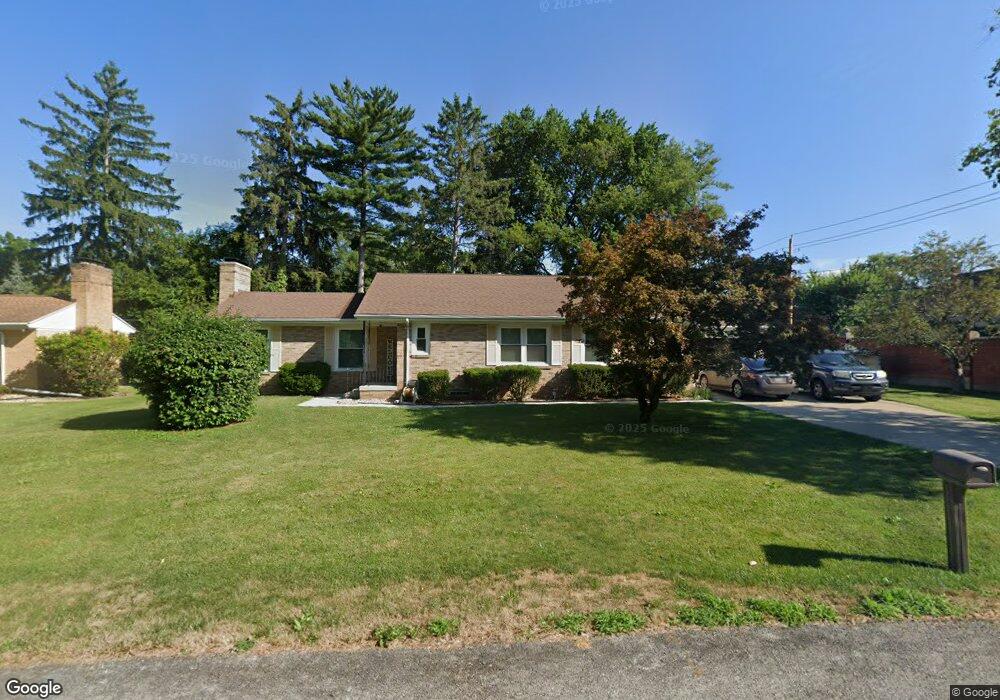
10 Pinecrest Dr Tiffin, OH 44883
Estimated Value: $237,000 - $289,000
2
Beds
2
Baths
1,584
Sq Ft
$165/Sq Ft
Est. Value
About This Home
This home is located at 10 Pinecrest Dr, Tiffin, OH 44883 and is currently estimated at $261,684, approximately $165 per square foot. 10 Pinecrest Dr is a home located in Seneca County with nearby schools including Columbian High School, Bridges Community Academy, and Calvert High School.
Ownership History
Date
Name
Owned For
Owner Type
Purchase Details
Closed on
Apr 10, 2019
Sold by
Lucius Cynthia A and Mary F Fox Trust
Bought by
Grabert Sterling J and Grabert Lisa W
Current Estimated Value
Home Financials for this Owner
Home Financials are based on the most recent Mortgage that was taken out on this home.
Original Mortgage
$146,700
Outstanding Balance
$128,975
Interest Rate
4.3%
Mortgage Type
Future Advance Clause Open End Mortgage
Estimated Equity
$132,709
Purchase Details
Closed on
Feb 24, 2009
Sold by
Fox Mary F
Bought by
Fox Mary F and Mary F Fox Trust
Purchase Details
Closed on
Mar 9, 1998
Sold by
Ols Timothy A
Bought by
Fox William J
Purchase Details
Closed on
Mar 16, 1994
Sold by
Routzahn Carlton E
Bought by
Ols Timothy A
Purchase Details
Closed on
Aug 20, 1993
Sold by
Krout Mary P
Bought by
Routzahn Carlton E
Create a Home Valuation Report for This Property
The Home Valuation Report is an in-depth analysis detailing your home's value as well as a comparison with similar homes in the area
Home Values in the Area
Average Home Value in this Area
Purchase History
| Date | Buyer | Sale Price | Title Company |
|---|---|---|---|
| Grabert Sterling J | $163,000 | None Available | |
| Fox Mary F | -- | None Available | |
| Fox William J | $125,000 | -- | |
| Ols Timothy A | $114,000 | -- | |
| Routzahn Carlton E | $89,900 | -- |
Source: Public Records
Mortgage History
| Date | Status | Borrower | Loan Amount |
|---|---|---|---|
| Open | Grabert Sterling J | $146,700 |
Source: Public Records
Tax History Compared to Growth
Tax History
| Year | Tax Paid | Tax Assessment Tax Assessment Total Assessment is a certain percentage of the fair market value that is determined by local assessors to be the total taxable value of land and additions on the property. | Land | Improvement |
|---|---|---|---|---|
| 2024 | $2,470 | $71,410 | $13,410 | $58,000 |
| 2023 | $2,472 | $71,410 | $13,410 | $58,000 |
| 2022 | $2,481 | $59,490 | $12,620 | $46,870 |
| 2021 | $2,439 | $59,490 | $12,620 | $46,870 |
| 2020 | $2,485 | $59,490 | $12,618 | $46,872 |
| 2019 | $2,276 | $52,693 | $11,176 | $41,517 |
| 2018 | $1,902 | $52,693 | $11,176 | $41,517 |
| 2017 | $1,948 | $52,693 | $11,176 | $41,517 |
| 2016 | $1,997 | $55,556 | $11,176 | $44,380 |
| 2015 | $1,974 | $55,556 | $11,176 | $44,380 |
| 2014 | $1,859 | $55,556 | $11,176 | $44,380 |
| 2013 | $1,929 | $55,556 | $11,176 | $44,380 |
Source: Public Records
Map
Nearby Homes
- 20 Pinecrest Dr
- 399 Melmore St
- 407 Melmore St
- 393 Melmore St
- 400 Melmore St
- 1 Wellington Place
- 30 Pinecrest Dr
- 385 Melmore St
- 429 Melmore St
- 438 Melmore St
- 435 Melmore St
- 375 Melmore St
- 28 Grandview Ct
- 24 Westview Ct
- 66 Pinecrest Dr
- 20 Grandview Ct
- 10 Wellington Place
- 365 Melmore St
- 25 Wellington Place
- 445 Melmore St