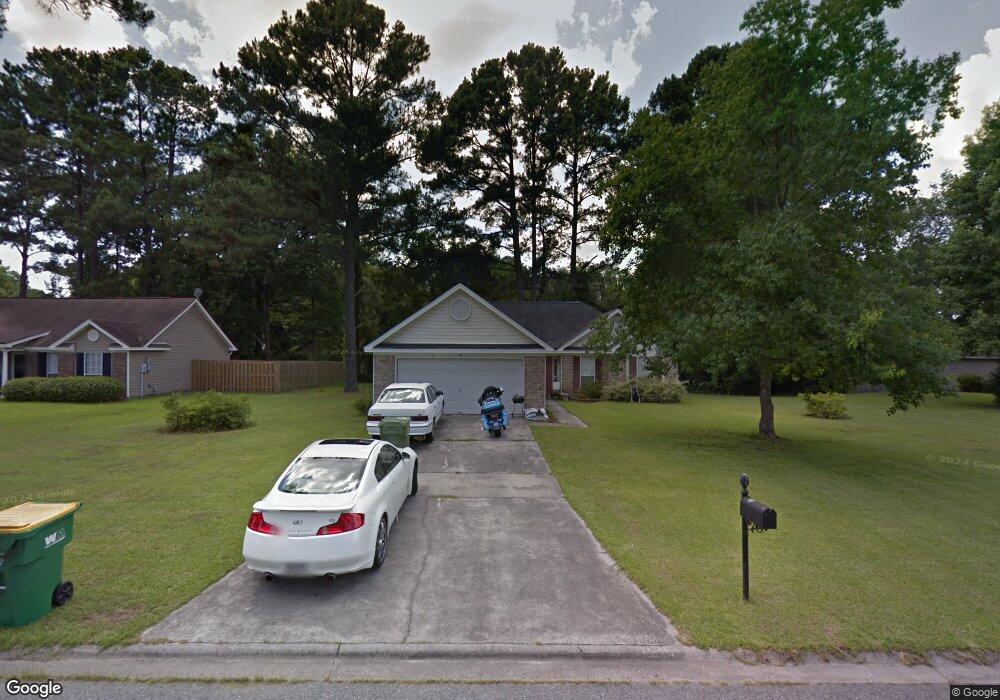
10 Pinehurst Ln Pooler, GA 31322
Estimated Value: $268,000 - $287,000
3
Beds
2
Baths
1,301
Sq Ft
$216/Sq Ft
Est. Value
About This Home
This home is located at 10 Pinehurst Ln, Pooler, GA 31322 and is currently estimated at $280,438, approximately $215 per square foot. 10 Pinehurst Ln is a home located in Chatham County with nearby schools including Pooler Elementary School, West Chatham Middle School, and Groves High School.
Ownership History
Date
Name
Owned For
Owner Type
Purchase Details
Closed on
Jul 26, 2016
Sold by
Stanley Mark S
Bought by
Duncan Brandy Nicole
Current Estimated Value
Home Financials for this Owner
Home Financials are based on the most recent Mortgage that was taken out on this home.
Original Mortgage
$124,601
Outstanding Balance
$99,864
Interest Rate
3.62%
Mortgage Type
FHA
Estimated Equity
$180,574
Purchase Details
Closed on
Mar 14, 2011
Sold by
Stanley Leslie W
Bought by
Stanley Mark S
Create a Home Valuation Report for This Property
The Home Valuation Report is an in-depth analysis detailing your home's value as well as a comparison with similar homes in the area
Home Values in the Area
Average Home Value in this Area
Purchase History
| Date | Buyer | Sale Price | Title Company |
|---|---|---|---|
| Duncan Brandy Nicole | $126,900 | -- | |
| Stanley Mark S | -- | -- |
Source: Public Records
Mortgage History
| Date | Status | Borrower | Loan Amount |
|---|---|---|---|
| Open | Duncan Brandy Nicole | $124,601 |
Source: Public Records
Tax History
| Year | Tax Paid | Tax Assessment Tax Assessment Total Assessment is a certain percentage of the fair market value that is determined by local assessors to be the total taxable value of land and additions on the property. | Land | Improvement |
|---|---|---|---|---|
| 2025 | $2,573 | $105,360 | $22,400 | $82,960 |
| 2024 | $29 | $93,480 | $18,000 | $75,480 |
| 2023 | $2,922 | $91,520 | $14,000 | $77,520 |
| 2022 | $2,100 | $84,000 | $14,000 | $70,000 |
| 2021 | $2,106 | $61,280 | $8,000 | $53,280 |
| 2020 | $2,095 | $61,280 | $8,000 | $53,280 |
| 2019 | $2,094 | $61,280 | $8,000 | $53,280 |
| 2018 | $1,725 | $50,400 | $8,000 | $42,400 |
| 2017 | $1,625 | $50,760 | $7,918 | $42,842 |
| 2016 | $1,503 | $46,840 | $8,000 | $38,840 |
| 2015 | $1,486 | $46,080 | $7,520 | $38,560 |
| 2014 | $2,243 | $47,160 | $0 | $0 |
Source: Public Records
Map
Nearby Homes
- 412 Rothwell St
- 220 N Skinner Ave
- 222 N Skinner Ave
- 125 Parsons Ave
- 127 Morgan St
- 131 Como Dr
- 610 Rogers St
- 104 Hinesley Way
- 105 Pinebury Rd
- 220 S Skinner Ave
- 1264 U S 80
- 304 E Tietgen St
- 407 Middleton St
- 220 Holly Ave
- 116 Windrush Pines
- 302 Governor Gwinnett Way
- 425 Governor Treutlen Cir
- 315 Governor Gwinnett Way
- 0 U S 80 Unit 322013
- 576 Governor Treutlen Cir
Your Personal Tour Guide
Ask me questions while you tour the home.