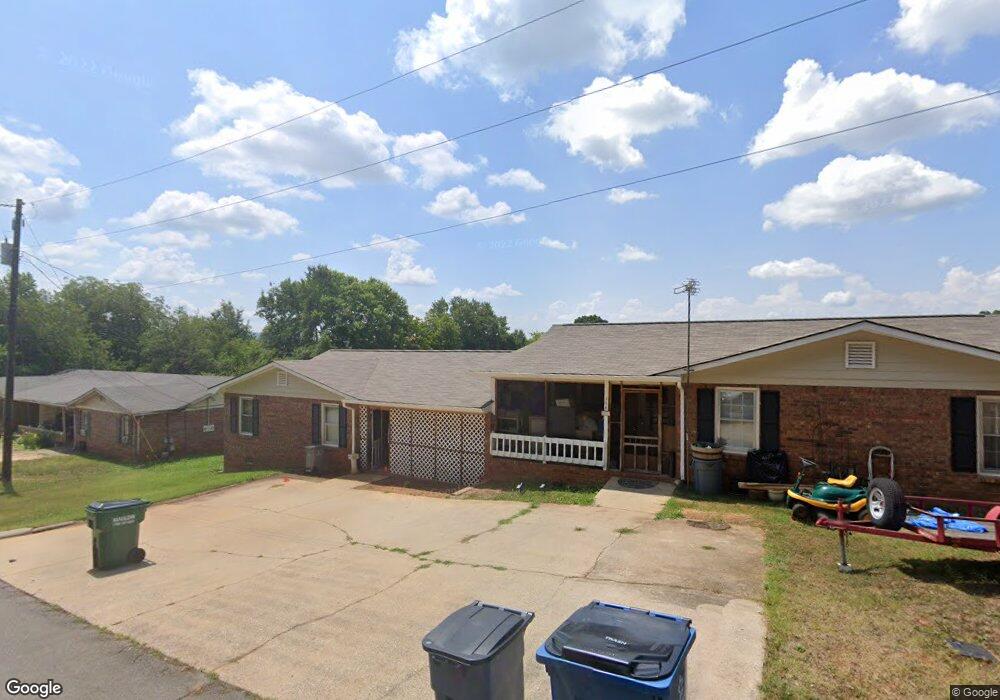
10 Pinewood Rd NW Unit A Cartersville, GA 30121
Estimated Value: $289,000 - $379,000
3
Beds
2
Baths
1,662
Sq Ft
$197/Sq Ft
Est. Value
About This Home
This home is located at 10 Pinewood Rd NW Unit A, Cartersville, GA 30121 and is currently estimated at $328,190, approximately $197 per square foot. 10 Pinewood Rd NW Unit A is a home located in Bartow County with nearby schools including Kingston Elementary School, Cass Middle School, and Cass High School.
Ownership History
Date
Name
Owned For
Owner Type
Purchase Details
Closed on
Apr 4, 2014
Sold by
Black V Mildred
Bought by
Breul Paul K and Breul Lori D
Current Estimated Value
Home Financials for this Owner
Home Financials are based on the most recent Mortgage that was taken out on this home.
Original Mortgage
$65,925
Outstanding Balance
$50,096
Interest Rate
4.33%
Mortgage Type
Commercial
Estimated Equity
$278,094
Purchase Details
Closed on
Apr 2, 2008
Sold by
Black V Mildred
Bought by
Black V Mildred and Price Brandy L
Home Financials for this Owner
Home Financials are based on the most recent Mortgage that was taken out on this home.
Original Mortgage
$80,000
Interest Rate
6.03%
Mortgage Type
New Conventional
Purchase Details
Closed on
Mar 14, 2008
Sold by
Black Douglas Lee
Bought by
Pace Brandy L
Home Financials for this Owner
Home Financials are based on the most recent Mortgage that was taken out on this home.
Original Mortgage
$80,000
Interest Rate
6.03%
Mortgage Type
New Conventional
Create a Home Valuation Report for This Property
The Home Valuation Report is an in-depth analysis detailing your home's value as well as a comparison with similar homes in the area
Home Values in the Area
Average Home Value in this Area
Purchase History
| Date | Buyer | Sale Price | Title Company |
|---|---|---|---|
| Breul Paul K | $87,900 | -- | |
| Black V Mildred | -- | -- | |
| Pace Brandy L | -- | -- |
Source: Public Records
Mortgage History
| Date | Status | Borrower | Loan Amount |
|---|---|---|---|
| Open | Breul Paul K | $65,925 | |
| Previous Owner | Black V Mildred | $80,000 |
Source: Public Records
Tax History Compared to Growth
Tax History
| Year | Tax Paid | Tax Assessment Tax Assessment Total Assessment is a certain percentage of the fair market value that is determined by local assessors to be the total taxable value of land and additions on the property. | Land | Improvement |
|---|---|---|---|---|
| 2024 | $2,624 | $113,978 | $20,000 | $93,978 |
| 2023 | $2,624 | $104,326 | $20,000 | $84,326 |
| 2022 | $2,011 | $91,222 | $20,000 | $71,222 |
| 2021 | $1,489 | $72,230 | $20,000 | $52,230 |
| 2020 | $1,533 | $72,230 | $20,000 | $52,230 |
| 2019 | $1,454 | $52,391 | $12,000 | $40,391 |
| 2018 | $1,156 | $41,502 | $4,000 | $37,502 |
| 2017 | $1,162 | $41,502 | $4,000 | $37,502 |
| 2016 | $993 | $35,200 | $4,000 | $31,200 |
| 2015 | $985 | $34,840 | $4,000 | $30,840 |
| 2014 | -- | $29,000 | $4,000 | $25,000 |
| 2013 | -- | $34,080 | $6,000 | $28,080 |
Source: Public Records
Map
Nearby Homes
- 22 Mill Rock Dr NW
- 15 Home Place Dr
- 602 Grassdale Rd
- 4 Shallowood Place
- 104 Amberidge Dr NW
- 383 Oakridge Dr SE
- 104 Gilreath Rd SE
- 0 Rudy York Rd NW Unit 10536144
- 00 Rudy York Rd NW
- 109 Amberidge Dr NW
- 30 Amberidge Dr NW
- 354 Oakridge Dr SE
- 125 Evergreen Trail SE
- 111 Elle Ct NW
- 111 Weston Way NW
- 59 Summer Place NW
- 128 Evergreen Trail Unit 4
- 27 Summer Place NW
- 10 Pinewood Rd NW
- 11 Sparrow Ct NW
- 0 Sparrow Ct NW
- 12B Pinewood Rd NW
- 12A Pinewood Rd NW
- 11 Jude Dr NW
- 10 Jude Dr NW
- 10
- 10 Falcon Cir NW
- 13 Jude Dr NW
- 12 Jude Dr NW
- 11 Cardinal Ct NW
- 13 Cardinal Ct NW
- 15 Cardinal Ct NW
- 15 Jude Dr NW
- 12 Falcon Cir NW
- 735 Grassdale Rd NW
- 14 Jude Dr NW
- 737 Grassdale Rd NW
- 733 Grassdale Rd NW