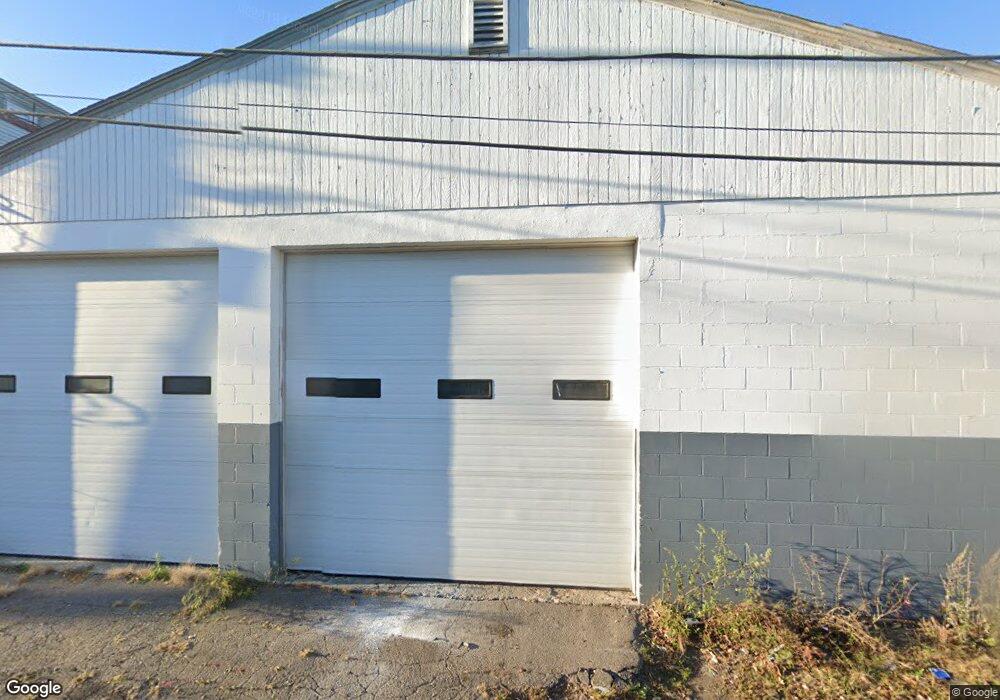
10 Pinkham St Brockton, MA 02301
Clifton Heights NeighborhoodEstimated Value: $810,037
2
Beds
1
Bath
5,000
Sq Ft
$162/Sq Ft
Est. Value
About This Home
This home is located at 10 Pinkham St, Brockton, MA 02301 and is currently estimated at $810,037, approximately $162 per square foot. 10 Pinkham St is a home located in Plymouth County with nearby schools including Gilmore Elementary School, Davis K-8 School, and John F. Kennedy Elementary School.
Ownership History
Date
Name
Owned For
Owner Type
Purchase Details
Closed on
May 6, 2013
Sold by
Cantave Marie and Rockland Trust Co
Bought by
Rockland Trust Co
Current Estimated Value
Purchase Details
Closed on
Dec 9, 2003
Sold by
Fargo Rt and Guerreiro Victor
Bought by
Cantave Gerard and Cantave Marie
Home Financials for this Owner
Home Financials are based on the most recent Mortgage that was taken out on this home.
Original Mortgage
$300,000
Interest Rate
6.03%
Mortgage Type
Commercial
Create a Home Valuation Report for This Property
The Home Valuation Report is an in-depth analysis detailing your home's value as well as a comparison with similar homes in the area
Home Values in the Area
Average Home Value in this Area
Purchase History
| Date | Buyer | Sale Price | Title Company |
|---|---|---|---|
| Rockland Trust Co | $125,000 | -- | |
| Rockland Trust Co | $125,000 | -- | |
| Cantave Gerard | $410,000 | -- | |
| Cantave Gerard | $410,000 | -- |
Source: Public Records
Mortgage History
| Date | Status | Borrower | Loan Amount |
|---|---|---|---|
| Previous Owner | Cantave Gerard | $300,000 |
Source: Public Records
Tax History Compared to Growth
Tax History
| Year | Tax Paid | Tax Assessment Tax Assessment Total Assessment is a certain percentage of the fair market value that is determined by local assessors to be the total taxable value of land and additions on the property. | Land | Improvement |
|---|---|---|---|---|
| 2025 | $12,865 | $531,600 | $273,100 | $258,500 |
| 2024 | $12,785 | $531,600 | $248,300 | $283,300 |
| 2023 | $11,066 | $425,300 | $215,400 | $209,900 |
| 2022 | $10,866 | $385,600 | $215,400 | $170,200 |
| 2021 | $10,905 | $367,900 | $205,100 | $162,800 |
| 2020 | $11,188 | $367,900 | $195,400 | $172,500 |
| 2019 | $11,138 | $351,700 | $195,400 | $156,300 |
| 2018 | $11,438 | $344,200 | $195,400 | $148,800 |
| 2017 | $11,101 | $337,000 | $195,400 | $141,600 |
| 2016 | $10,525 | $328,700 | $195,360 | $133,340 |
| 2015 | $11,136 | $328,700 | $195,360 | $133,340 |
| 2014 | $11,163 | $328,700 | $195,360 | $133,340 |
Source: Public Records
Map
Nearby Homes
- 1002 Main St
- 1006 Main St
- 1012 Main St
- 1000 Main St
- 967 Montello St
- 1040 Main St
- 13 Snell Place
- 13 Snell Place Unit 1
- 13 Snell Place Unit 3
- 13 Snell Place Unit 2
- 7 Tremont St
- 7 Tremont St
- 9 Snell Place
- 114 Denton Street Extension
- 114 Denton St
- 11 Tremont St
- 1007 Montello St
- 108 Denton Street Extension
- 1047 Main St
- 957 Main St Unit 1