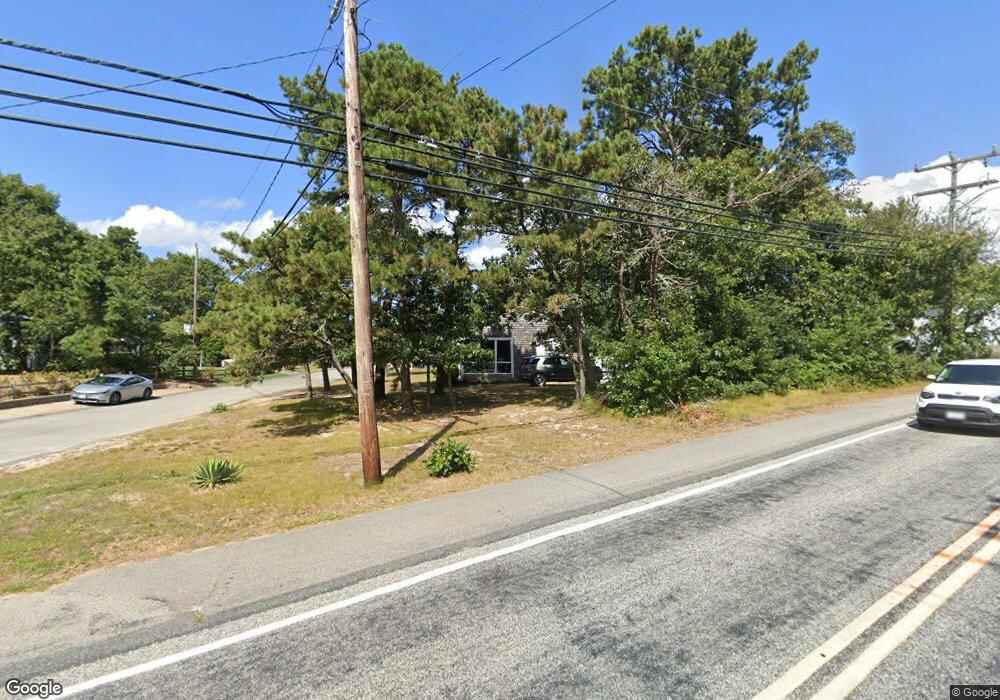
10 Plashes Dr Dennis Port, MA 02639
Dennis Port NeighborhoodEstimated Value: $611,000 - $654,000
3
Beds
2
Baths
1,092
Sq Ft
$575/Sq Ft
Est. Value
About This Home
This home is located at 10 Plashes Dr, Dennis Port, MA 02639 and is currently estimated at $627,755, approximately $574 per square foot. 10 Plashes Dr is a home located in Barnstable County with nearby schools including Dennis-Yarmouth Regional High School and St. Pius X. School.
Ownership History
Date
Name
Owned For
Owner Type
Purchase Details
Closed on
Oct 23, 2012
Sold by
Chan Sheila and Summers Michelle
Bought by
Chan Sheila and Chan Mark
Current Estimated Value
Purchase Details
Closed on
Sep 5, 2007
Sold by
Chan Mark and Chan Sheila
Bought by
Kelly Michelle and Chan Sheila
Home Financials for this Owner
Home Financials are based on the most recent Mortgage that was taken out on this home.
Original Mortgage
$266,000
Interest Rate
6.74%
Mortgage Type
Purchase Money Mortgage
Purchase Details
Closed on
Jul 12, 2005
Sold by
England Mark D
Bought by
Berube Dennis P and Berube Susan A
Home Financials for this Owner
Home Financials are based on the most recent Mortgage that was taken out on this home.
Original Mortgage
$238,500
Interest Rate
5.71%
Mortgage Type
Purchase Money Mortgage
Purchase Details
Closed on
Apr 2, 1999
Sold by
White Mary T and White Ann M
Bought by
England Mark D and England Susan M
Home Financials for this Owner
Home Financials are based on the most recent Mortgage that was taken out on this home.
Original Mortgage
$123,950
Interest Rate
6.78%
Mortgage Type
Purchase Money Mortgage
Create a Home Valuation Report for This Property
The Home Valuation Report is an in-depth analysis detailing your home's value as well as a comparison with similar homes in the area
Home Values in the Area
Average Home Value in this Area
Purchase History
| Date | Buyer | Sale Price | Title Company |
|---|---|---|---|
| Chan Sheila | -- | -- | |
| Kelly Michelle | -- | -- | |
| Chan Mark | $332,500 | -- | |
| Berube Dennis P | $318,000 | -- | |
| England Mark D | $134,500 | -- |
Source: Public Records
Mortgage History
| Date | Status | Borrower | Loan Amount |
|---|---|---|---|
| Previous Owner | Chan Mark | $266,000 | |
| Previous Owner | Chan Mark | $49,800 | |
| Previous Owner | Berube Dennis P | $238,500 | |
| Previous Owner | England Mark D | $123,950 | |
| Previous Owner | England Mark D | $25,000 |
Source: Public Records
Tax History
| Year | Tax Paid | Tax Assessment Tax Assessment Total Assessment is a certain percentage of the fair market value that is determined by local assessors to be the total taxable value of land and additions on the property. | Land | Improvement |
|---|---|---|---|---|
| 2025 | $2,366 | $546,500 | $191,000 | $355,500 |
| 2024 | $2,246 | $511,600 | $183,700 | $327,900 |
| 2023 | $2,172 | $465,100 | $167,000 | $298,100 |
| 2022 | $2,084 | $372,200 | $150,400 | $221,800 |
| 2021 | $3,078 | $330,700 | $147,500 | $183,200 |
| 2020 | $1,825 | $299,200 | $136,100 | $163,100 |
| 2019 | $1,718 | $278,400 | $133,500 | $144,900 |
| 2018 | $2,770 | $267,600 | $137,600 | $130,000 |
| 2017 | $1,555 | $252,800 | $127,000 | $125,800 |
| 2016 | $1,549 | $237,200 | $132,300 | $104,900 |
| 2015 | $1,518 | $237,200 | $132,300 | $104,900 |
| 2014 | $1,397 | $220,000 | $116,500 | $103,500 |
Source: Public Records
Map
Nearby Homes
- 22 Ferncliff Rd
- 59 Sea St
- 104 Toms Path
- 104 Toms Path
- 37-A Beach Hills Rd
- 38 Cranberry Ln
- 37 Beach Hills Rd
- 41 Center St
- 205 Lower County Rd Unit 8
- 262 Old Wharf Rd Unit 67
- 262 Old Wharf Rd Unit 5
- 262 Old Wharf Rd Unit 5
- 262 Old Wharf Rd Unit 87
- 9 Chase Ave Unit 6
- 230 Old Wharf Rd Unit 272
- 230 Old Wharf Rd Unit 265
- 241 Old Wharf Rd Unit 127
- 268 Main St
- 10 Candlewood Ln Unit 2
- 10 Candlewood Ln Unit 2-10
- 16 Plashes Dr
- 4 Plashes Dr
- 11 Plashes Dr
- 314 Lower County Rd
- 7 Plashes Dr
- 15 Plashes Dr
- 20 Plashes Dr
- 318 Lower County Rd
- 3 Plashes Dr
- 300 Lower County Rd
- 15 Little Way
- 321 Lower County Rd
- 311 Lower County Rd
- 24 Plashes Dr
- 3 Little Way
- 294 Lower County Rd
- 320 Lower County Rd
- 309 Lower County Rd
- 322 Lower County Rd
- 327 Lower County Rd
Your Personal Tour Guide
Ask me questions while you tour the home.