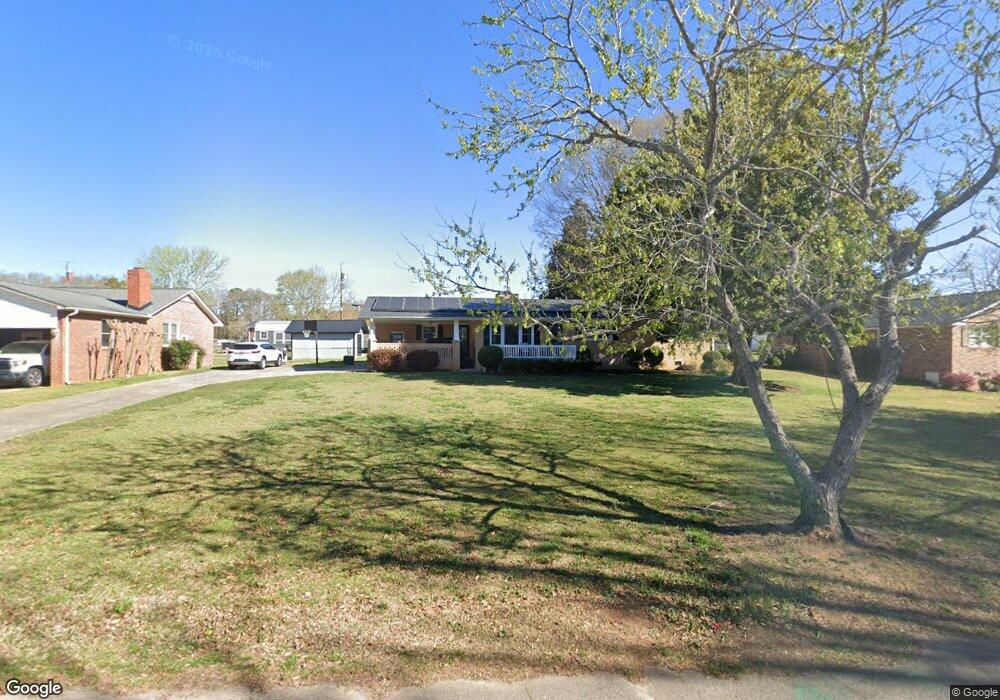
10 Polly St Honea Path, SC 29654
Estimated Value: $209,057 - $230,000
3
Beds
2
Baths
1,508
Sq Ft
$144/Sq Ft
Est. Value
About This Home
This home is located at 10 Polly St, Honea Path, SC 29654 and is currently estimated at $217,014, approximately $143 per square foot. 10 Polly St is a home located in Anderson County with nearby schools including Belton Honea Path High School and Whispering Pines Mennonite School.
Ownership History
Date
Name
Owned For
Owner Type
Purchase Details
Closed on
Jul 22, 2019
Sold by
Smith Kevin and Smith Kevin Partick
Bought by
Smith Kevin Patrick and Smith Jennifer Lynn
Current Estimated Value
Purchase Details
Closed on
Feb 25, 2014
Sold by
Hart Emily
Bought by
Smith Kevin
Purchase Details
Closed on
Aug 27, 2008
Sold by
Smith Kevin
Bought by
Smith Emily
Home Financials for this Owner
Home Financials are based on the most recent Mortgage that was taken out on this home.
Original Mortgage
$144,281
Interest Rate
6.48%
Mortgage Type
FHA
Create a Home Valuation Report for This Property
The Home Valuation Report is an in-depth analysis detailing your home's value as well as a comparison with similar homes in the area
Home Values in the Area
Average Home Value in this Area
Purchase History
| Date | Buyer | Sale Price | Title Company |
|---|---|---|---|
| Smith Kevin Patrick | -- | None Available | |
| Smith Kevin Patrick | -- | None Available | |
| Smith Kevin | -- | -- | |
| Smith Emily | -- | -- |
Source: Public Records
Mortgage History
| Date | Status | Borrower | Loan Amount |
|---|---|---|---|
| Previous Owner | Smith Emily | $144,281 |
Source: Public Records
Tax History Compared to Growth
Tax History
| Year | Tax Paid | Tax Assessment Tax Assessment Total Assessment is a certain percentage of the fair market value that is determined by local assessors to be the total taxable value of land and additions on the property. | Land | Improvement |
|---|---|---|---|---|
| 2024 | $681 | $5,160 | $560 | $4,600 |
| 2023 | $681 | $5,160 | $560 | $4,600 |
| 2022 | $655 | $5,160 | $560 | $4,600 |
| 2021 | $596 | $4,370 | $520 | $3,850 |
| 2020 | $590 | $6,560 | $780 | $5,780 |
| 2019 | $590 | $4,370 | $520 | $3,850 |
| 2018 | $603 | $4,370 | $520 | $3,850 |
| 2017 | $554 | $4,370 | $520 | $3,850 |
| 2016 | $554 | $5,840 | $480 | $5,360 |
| 2015 | $2,151 | $3,890 | $320 | $3,570 |
| 2014 | $545 | $3,890 | $320 | $3,570 |
Source: Public Records
Map
Nearby Homes
- 00 Bagwell Dr
- 701 W Greer St
- 244 Wildwood Dr
- 310 Oak Dr
- 202 Pete Armstrong Rd
- 7 Carlisle Dr
- 1 Mitchell St
- 106 Emma Dr
- 511 N Main St
- 600 N Main St
- 112 Brookside Cir
- 229 Armstrong Rd
- 11306 Belton Honea Path Hwy
- 1 E McGee St
- 704 Sherwood Ave
- 210 Blue Barker Rd
- 227 S Main St
- 14 Riley St
- 305 Tribble St
- 307 Tribble St