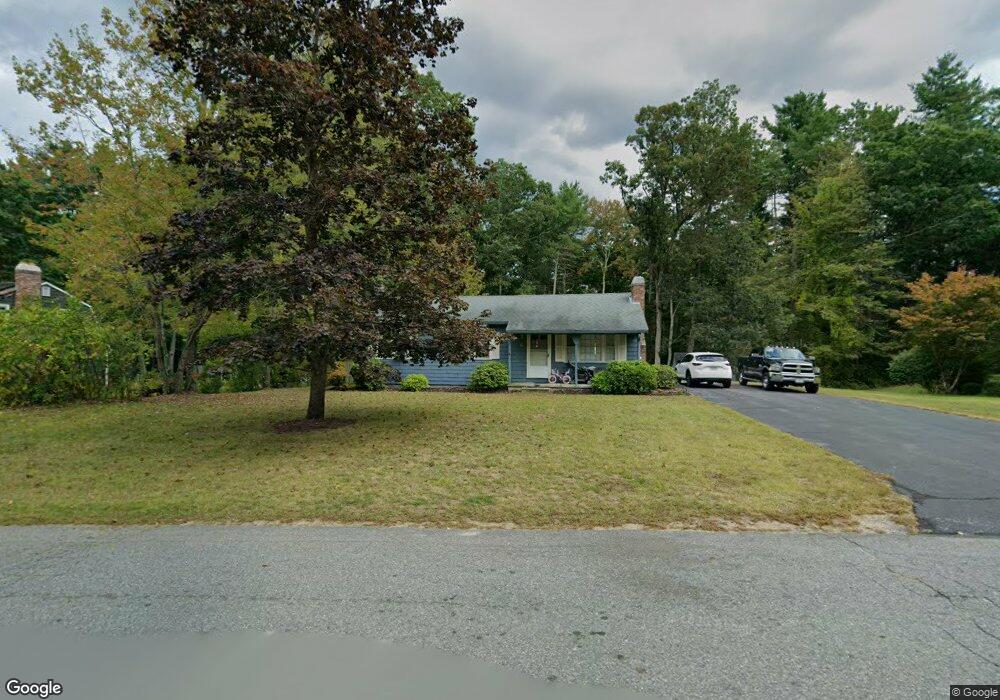
10 Ponderosa Dr Townsend, MA 01469
Estimated Value: $449,267 - $528,000
3
Beds
1
Bath
1,613
Sq Ft
$306/Sq Ft
Est. Value
About This Home
This home is located at 10 Ponderosa Dr, Townsend, MA 01469 and is currently estimated at $492,817, approximately $305 per square foot. 10 Ponderosa Dr is a home located in Middlesex County with nearby schools including North Middlesex Regional High School.
Ownership History
Date
Name
Owned For
Owner Type
Purchase Details
Closed on
Oct 1, 1999
Sold by
Household Fin Corp 2
Bought by
Parsons Mark K and Parsons Steven M
Current Estimated Value
Home Financials for this Owner
Home Financials are based on the most recent Mortgage that was taken out on this home.
Original Mortgage
$127,031
Outstanding Balance
$38,415
Interest Rate
7.85%
Mortgage Type
Purchase Money Mortgage
Estimated Equity
$454,402
Purchase Details
Closed on
Jun 25, 1999
Sold by
Collins Anita J and Ocwen Fed Bk
Bought by
Household Finc Corp 2
Create a Home Valuation Report for This Property
The Home Valuation Report is an in-depth analysis detailing your home's value as well as a comparison with similar homes in the area
Home Values in the Area
Average Home Value in this Area
Purchase History
| Date | Buyer | Sale Price | Title Company |
|---|---|---|---|
| Parsons Mark K | $135,000 | -- | |
| Household Finc Corp 2 | $110,000 | -- |
Source: Public Records
Mortgage History
| Date | Status | Borrower | Loan Amount |
|---|---|---|---|
| Open | Household Finc Corp 2 | $127,031 | |
| Previous Owner | Household Finc Corp 2 | $35,100 | |
| Previous Owner | Household Finc Corp 2 | $33,682 |
Source: Public Records
Tax History Compared to Growth
Tax History
| Year | Tax Paid | Tax Assessment Tax Assessment Total Assessment is a certain percentage of the fair market value that is determined by local assessors to be the total taxable value of land and additions on the property. | Land | Improvement |
|---|---|---|---|---|
| 2025 | $4,983 | $343,200 | $91,200 | $252,000 |
| 2024 | $4,888 | $339,200 | $91,200 | $248,000 |
| 2023 | $4,442 | $291,100 | $78,700 | $212,400 |
| 2022 | $4,586 | $260,400 | $72,100 | $188,300 |
| 2021 | $4,733 | $258,200 | $71,300 | $186,900 |
| 2020 | $4,572 | $234,200 | $64,700 | $169,500 |
| 2019 | $4,502 | $232,900 | $64,700 | $168,200 |
| 2018 | $4,145 | $204,600 | $58,000 | $146,600 |
| 2017 | $3,912 | $198,900 | $60,900 | $138,000 |
| 2016 | $3,615 | $182,600 | $60,900 | $121,700 |
| 2015 | $3,671 | $192,100 | $67,600 | $124,500 |
| 2014 | $3,405 | $174,000 | $63,400 | $110,600 |
Source: Public Records
Map
Nearby Homes