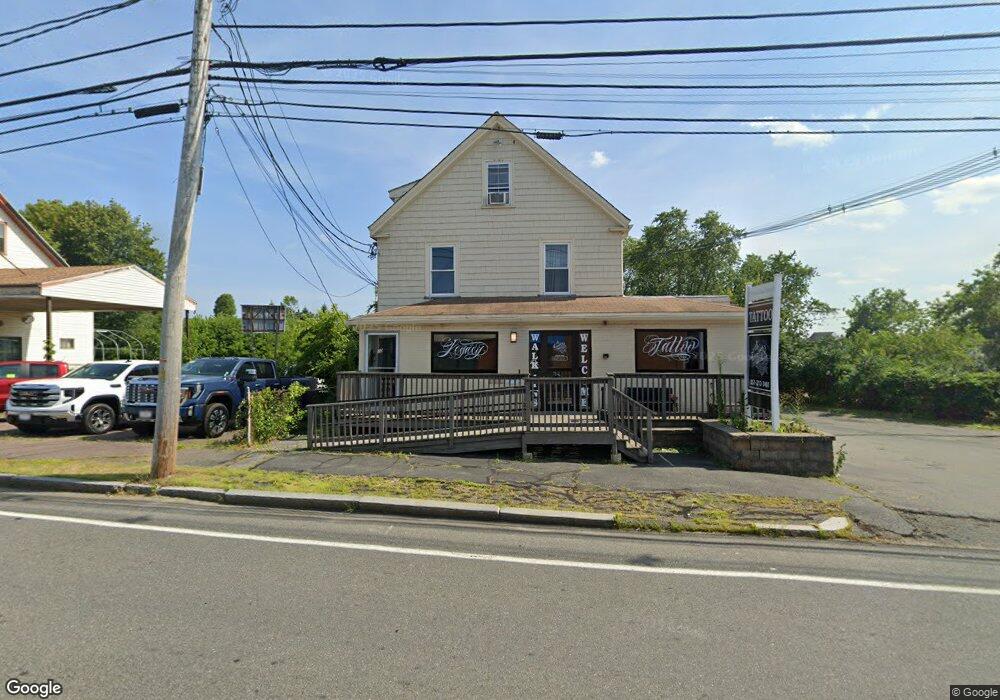
10 Purchase St Unit D Danvers, MA 01923
Estimated Value: $831,000
4
Beds
2
Baths
334
Sq Ft
$2,488/Sq Ft
Est. Value
About This Home
This home is located at 10 Purchase St Unit D, Danvers, MA 01923 and is currently estimated at $831,000, approximately $2,488 per square foot. 10 Purchase St Unit D is a home located in Essex County with nearby schools including St. Mary of the Annunciation School and Bishop Fenwick High School.
Ownership History
Date
Name
Owned For
Owner Type
Purchase Details
Closed on
Dec 22, 2021
Sold by
Nicastro Angie J and Nicastro John P
Bought by
Nicastro John P
Current Estimated Value
Purchase Details
Closed on
Jun 17, 2016
Sold by
Lci Realty Llc
Bought by
Nicastro John P and Nicastro Angie J
Home Financials for this Owner
Home Financials are based on the most recent Mortgage that was taken out on this home.
Original Mortgage
$400,000
Interest Rate
3.61%
Mortgage Type
Commercial
Purchase Details
Closed on
Aug 30, 2012
Sold by
Kusco Llc
Bought by
Lci Realty Llc
Purchase Details
Closed on
Apr 14, 2000
Sold by
Pat Rt
Bought by
Kusco Llc
Purchase Details
Closed on
Aug 29, 1997
Sold by
Cri Nik Rt
Bought by
Pat Rt
Purchase Details
Closed on
Jul 14, 1988
Sold by
Cogan Robert C
Bought by
Cri Nik Rt
Create a Home Valuation Report for This Property
The Home Valuation Report is an in-depth analysis detailing your home's value as well as a comparison with similar homes in the area
Home Values in the Area
Average Home Value in this Area
Purchase History
| Date | Buyer | Sale Price | Title Company |
|---|---|---|---|
| Nicastro John P | -- | None Available | |
| Nicastro John P | -- | None Available | |
| Nicastro John P | -- | None Available | |
| Nicastro John P | $445,000 | -- | |
| Lci Realty Llc | $357,000 | -- | |
| Kusco Llc | $395,000 | -- | |
| Kusco Llc | $395,000 | -- | |
| Pat Rt | $275,000 | -- | |
| Pat Rt | $275,000 | -- | |
| Cri Nik Rt | $200,000 | -- |
Source: Public Records
Mortgage History
| Date | Status | Borrower | Loan Amount |
|---|---|---|---|
| Previous Owner | Nicastro John P | $400,000 | |
| Previous Owner | Cri Nik Rt | $345,000 |
Source: Public Records
Tax History Compared to Growth
Tax History
| Year | Tax Paid | Tax Assessment Tax Assessment Total Assessment is a certain percentage of the fair market value that is determined by local assessors to be the total taxable value of land and additions on the property. | Land | Improvement |
|---|---|---|---|---|
| 2025 | -- | $765,600 | $313,200 | $452,400 |
| 2024 | -- | $716,200 | $295,800 | $420,400 |
| 2023 | $0 | $678,900 | $266,800 | $412,100 |
| 2022 | $0 | $579,300 | $232,000 | $347,300 |
| 2021 | $0 | $537,600 | $222,700 | $314,900 |
| 2020 | $0 | $590,100 | $232,000 | $358,100 |
| 2019 | $0 | $450,100 | $189,100 | $261,000 |
| 2018 | $0 | $429,400 | $189,100 | $240,300 |
| 2017 | $0 | $384,100 | $174,000 | $210,100 |
| 2016 | -- | $384,100 | $174,000 | $210,100 |
| 2015 | -- | $356,600 | $150,800 | $205,800 |
Source: Public Records
Map
Nearby Homes
- 24 Purchase St
- 86 Abington Rd Unit 86
- 108 Abington Rd Unit 108
- 112 Abington Rd
- 14 1/2 Hampshire St
- 5 Hampshire St
- 166 High St
- 20 Ash St Unit 3
- 20 Ash St Unit 1
- 37 Constitution Ln Unit 12
- 5 Beacon St
- 38 High St Unit 4
- 35 High St Unit 3D
- 8 Putnam St Unit 3
- 11 Holten St
- 9 Endicott St Unit B
- 63 Adams St
- 25 Cherry St Unit 3
- 81 Elliott St
- 37 Holten St Unit 2
- 10 Purchase St
- 8 Purchase St
- 2 Pleasant Ave
- 4 Pleasant Ave
- 14 Purchase St
- 6 Pleasant Ave
- 8 Pleasant Ave
- 107 High St
- 10 Pleasant Ave
- 15 Purchase St
- 3 Pleasant Ave
- 18 Purchase St
- 5 Pleasant Ave
- 14 Pleasant Ave
- 7 Pleasant Ave
- 7 Pleasant Ave Unit 1
- 11 Pleasant Ave
- 20 Purchase St
- 9 Pleasant Ave
- 106 High St Unit 2