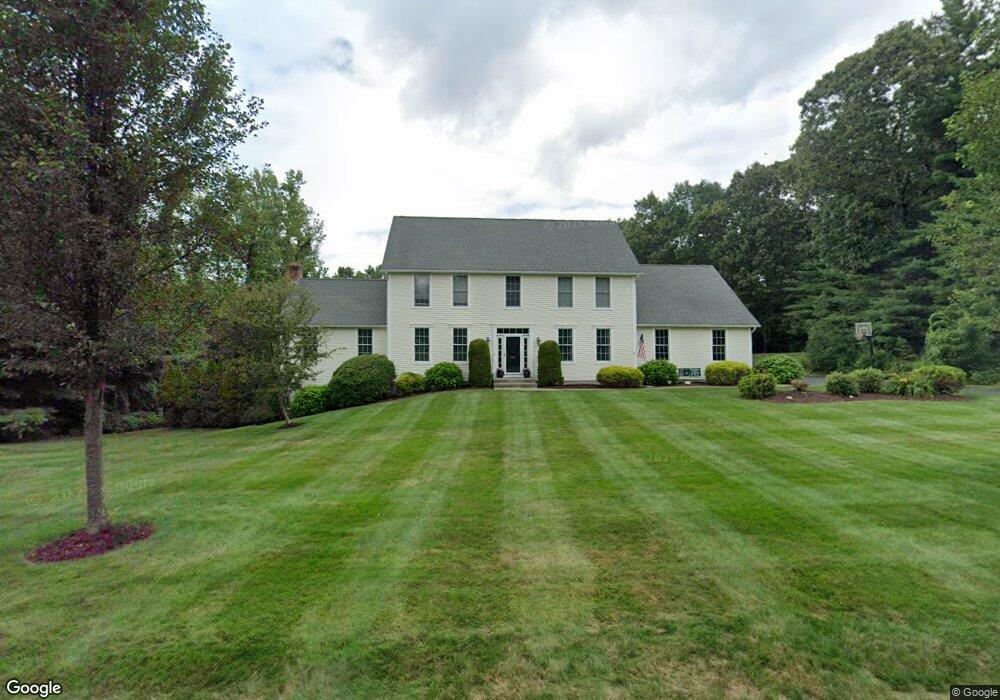
10 Red Gap Rd Wilbraham, MA 01095
Estimated Value: $723,436 - $893,000
4
Beds
3
Baths
3,125
Sq Ft
$252/Sq Ft
Est. Value
About This Home
This home is located at 10 Red Gap Rd, Wilbraham, MA 01095 and is currently estimated at $786,609, approximately $251 per square foot. 10 Red Gap Rd is a home located in Hampden County with nearby schools including Minnechaug Regional High School and Wilbraham & Monson Academy.
Ownership History
Date
Name
Owned For
Owner Type
Purchase Details
Closed on
Aug 19, 2005
Sold by
Kapoian Gregory M and Kapoian Jane A
Bought by
Meunier Danielle R and Meunier Marc C
Current Estimated Value
Home Financials for this Owner
Home Financials are based on the most recent Mortgage that was taken out on this home.
Original Mortgage
$436,000
Outstanding Balance
$229,036
Interest Rate
5.66%
Mortgage Type
Purchase Money Mortgage
Estimated Equity
$557,573
Purchase Details
Closed on
Sep 25, 2003
Sold by
Wilbraview Lp
Bought by
Kapoian Gregory M and Kapoian Jane A
Home Financials for this Owner
Home Financials are based on the most recent Mortgage that was taken out on this home.
Original Mortgage
$180,000
Interest Rate
6.29%
Mortgage Type
Purchase Money Mortgage
Create a Home Valuation Report for This Property
The Home Valuation Report is an in-depth analysis detailing your home's value as well as a comparison with similar homes in the area
Home Values in the Area
Average Home Value in this Area
Purchase History
| Date | Buyer | Sale Price | Title Company |
|---|---|---|---|
| Meunier Danielle R | $545,000 | -- | |
| Kapoian Gregory M | $90,000 | -- |
Source: Public Records
Mortgage History
| Date | Status | Borrower | Loan Amount |
|---|---|---|---|
| Open | Meunier Danielle R | $436,000 | |
| Closed | Meunier Danielle R | $54,500 | |
| Previous Owner | Kapoian Gregory M | $180,000 |
Source: Public Records
Tax History Compared to Growth
Tax History
| Year | Tax Paid | Tax Assessment Tax Assessment Total Assessment is a certain percentage of the fair market value that is determined by local assessors to be the total taxable value of land and additions on the property. | Land | Improvement |
|---|---|---|---|---|
| 2025 | $11,615 | $649,600 | $132,100 | $517,500 |
| 2024 | $11,272 | $609,300 | $132,100 | $477,200 |
| 2023 | $10,296 | $551,100 | $132,100 | $419,000 |
| 2022 | $10,296 | $502,500 | $132,100 | $370,400 |
| 2021 | $10,291 | $448,200 | $130,700 | $317,500 |
| 2020 | $10,031 | $448,200 | $130,700 | $317,500 |
| 2019 | $9,773 | $448,300 | $130,700 | $317,600 |
| 2018 | $9,722 | $429,400 | $130,700 | $298,700 |
| 2017 | $9,447 | $429,400 | $130,700 | $298,700 |
| 2016 | $9,526 | $441,000 | $144,700 | $296,300 |
| 2015 | $9,208 | $441,000 | $144,700 | $296,300 |
Source: Public Records
Map
Nearby Homes
- 603 Glendale Rd
- 60 Lakeshore Dr
- 733 Monson Rd
- 474-480 Mountain Rd
- 474 Mountain Rd
- 6 Hilltop Park
- 72 Beebe Rd
- 17 Peak Rd
- 20 Old Orchard Rd
- 182 Mountain Rd
- 68 Monson Rd
- 2 Bayberry Dr Unit 51
- 254 Ames Rd
- 2 Vista Rd
- 8 Patriot Ridge Ln
- 28 Decorie Dr
- 79 High Pine Cir
- 69 High Pine Cir
- 54 High Pine Cir
- 187 Hovey Rd