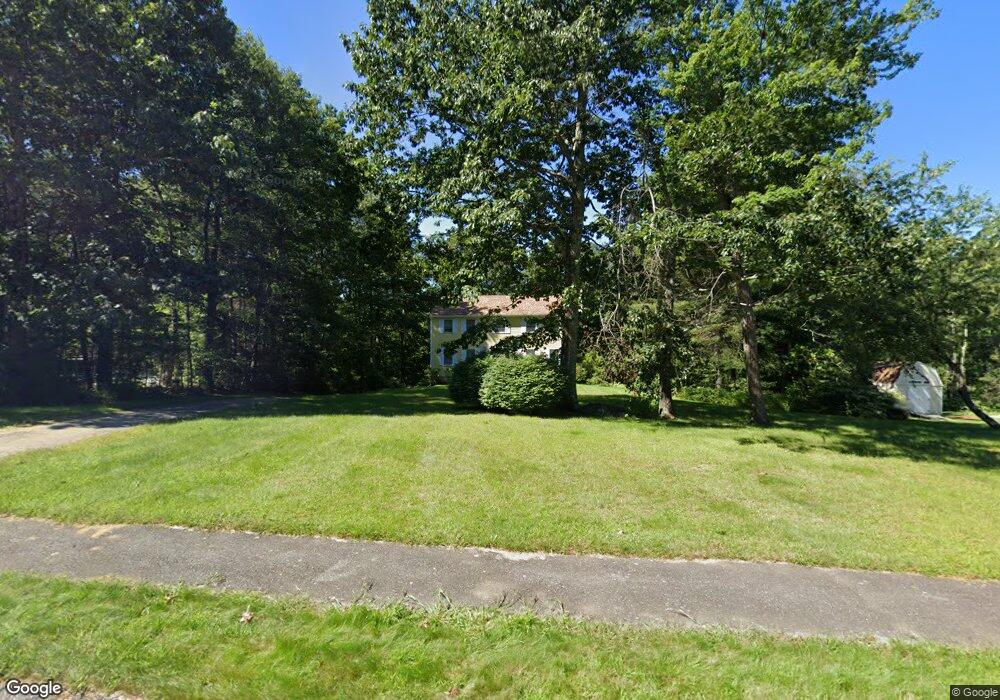
10 Red Oak St Paxton, MA 01612
Estimated Value: $570,000 - $632,000
4
Beds
3
Baths
2,080
Sq Ft
$294/Sq Ft
Est. Value
About This Home
This home is located at 10 Red Oak St, Paxton, MA 01612 and is currently estimated at $611,490, approximately $293 per square foot. 10 Red Oak St is a home located in Worcester County with nearby schools including Wachusett Regional High School.
Ownership History
Date
Name
Owned For
Owner Type
Purchase Details
Closed on
Aug 29, 2006
Sold by
Shea Cornelius and Shea Deidre
Bought by
Jordan Philip J and Clinton William M
Current Estimated Value
Purchase Details
Closed on
Nov 4, 1991
Sold by
Paxton Pond Rt
Bought by
Shea Neil
Create a Home Valuation Report for This Property
The Home Valuation Report is an in-depth analysis detailing your home's value as well as a comparison with similar homes in the area
Home Values in the Area
Average Home Value in this Area
Purchase History
| Date | Buyer | Sale Price | Title Company |
|---|---|---|---|
| Jordan Philip J | $300,000 | -- | |
| Shea Neil | $55,000 | -- |
Source: Public Records
Mortgage History
| Date | Status | Borrower | Loan Amount |
|---|---|---|---|
| Previous Owner | Shea Neil | $96,000 | |
| Previous Owner | Shea Neil | $100,000 |
Source: Public Records
Tax History Compared to Growth
Tax History
| Year | Tax Paid | Tax Assessment Tax Assessment Total Assessment is a certain percentage of the fair market value that is determined by local assessors to be the total taxable value of land and additions on the property. | Land | Improvement |
|---|---|---|---|---|
| 2025 | $7,376 | $500,400 | $120,500 | $379,900 |
| 2024 | $7,561 | $470,500 | $120,500 | $350,000 |
| 2023 | $7,359 | $418,600 | $109,800 | $308,800 |
| 2022 | $7,021 | $369,900 | $109,800 | $260,100 |
| 2021 | $3,829 | $337,400 | $100,300 | $237,100 |
| 2020 | $6,483 | $328,600 | $91,500 | $237,100 |
| 2019 | $6,325 | $320,400 | $83,300 | $237,100 |
| 2018 | $3,401 | $289,400 | $76,400 | $213,000 |
| 2017 | $5,728 | $280,900 | $72,800 | $208,100 |
| 2016 | $5,685 | $276,100 | $72,800 | $203,300 |
| 2015 | $5,314 | $255,600 | $72,800 | $182,800 |
| 2014 | $5,152 | $251,200 | $72,900 | $178,300 |
Source: Public Records
Map
Nearby Homes