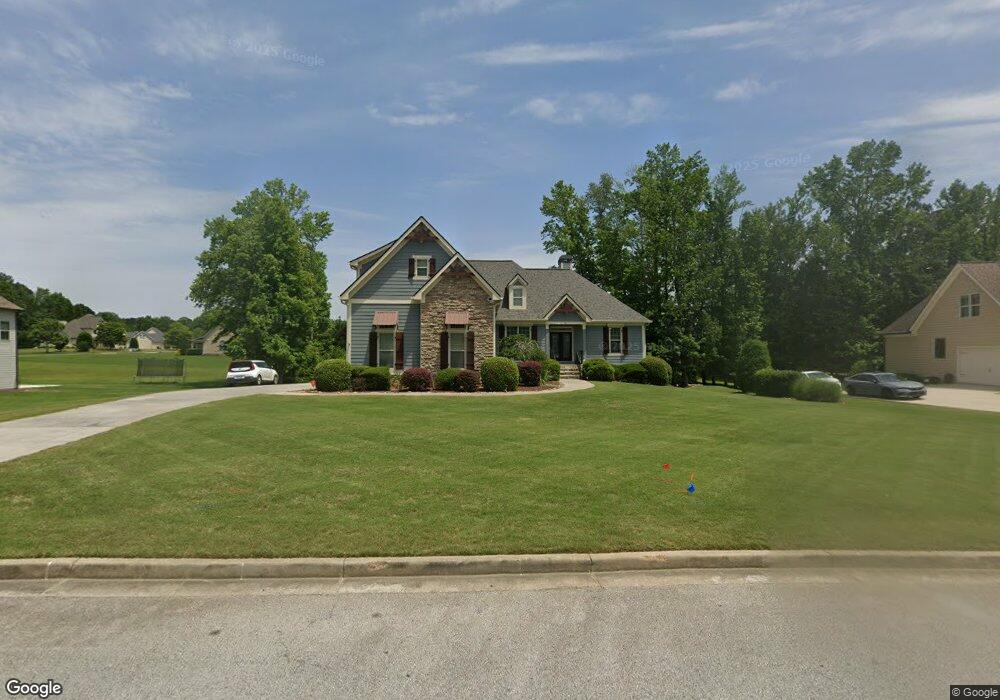
10 Red Oak Trail Sharpsburg, GA 30277
Estimated Value: $674,000 - $749,000
5
Beds
5
Baths
3,984
Sq Ft
$183/Sq Ft
Est. Value
About This Home
This home is located at 10 Red Oak Trail, Sharpsburg, GA 30277 and is currently estimated at $727,412, approximately $182 per square foot. 10 Red Oak Trail is a home located in Coweta County with nearby schools including Poplar Road Elementary School, East Coweta Middle School, and East Coweta High School.
Ownership History
Date
Name
Owned For
Owner Type
Purchase Details
Closed on
Apr 8, 2024
Sold by
Magnus Christopher
Bought by
Magnus Christopher James Tr and Spigener Meghan Spigener Tr
Current Estimated Value
Purchase Details
Closed on
Mar 9, 2022
Sold by
Braswell Teresa C
Bought by
Magnus Christopher and Spigener Meghan B
Home Financials for this Owner
Home Financials are based on the most recent Mortgage that was taken out on this home.
Original Mortgage
$554,000
Interest Rate
3.92%
Mortgage Type
New Conventional
Purchase Details
Closed on
May 16, 2008
Sold by
Hylite Homes Inc
Bought by
Braswell Sidney G and Braswell Teresa C
Home Financials for this Owner
Home Financials are based on the most recent Mortgage that was taken out on this home.
Original Mortgage
$292,000
Interest Rate
5.86%
Mortgage Type
New Conventional
Purchase Details
Closed on
Sep 3, 1998
Sold by
Corbitt Alice L
Bought by
Corbitt Joseph H
Purchase Details
Closed on
Oct 31, 1988
Bought by
Corbitt Alice L
Create a Home Valuation Report for This Property
The Home Valuation Report is an in-depth analysis detailing your home's value as well as a comparison with similar homes in the area
Home Values in the Area
Average Home Value in this Area
Purchase History
| Date | Buyer | Sale Price | Title Company |
|---|---|---|---|
| Magnus Christopher James Tr | -- | -- | |
| Magnus Christopher | $692,500 | -- | |
| Braswell Sidney G | $365,000 | -- | |
| Corbitt Joseph H | -- | -- | |
| Corbitt Alice L | -- | -- |
Source: Public Records
Mortgage History
| Date | Status | Borrower | Loan Amount |
|---|---|---|---|
| Previous Owner | Magnus Christopher | $554,000 | |
| Previous Owner | Braswell Sidney G | $292,000 |
Source: Public Records
Tax History Compared to Growth
Tax History
| Year | Tax Paid | Tax Assessment Tax Assessment Total Assessment is a certain percentage of the fair market value that is determined by local assessors to be the total taxable value of land and additions on the property. | Land | Improvement |
|---|---|---|---|---|
| 2025 | $6,229 | $256,309 | $36,000 | $220,309 |
| 2024 | $6,162 | $255,784 | $36,000 | $219,784 |
| 2023 | $6,162 | $243,462 | $36,000 | $207,462 |
| 2022 | $5,015 | $196,322 | $30,000 | $166,322 |
| 2021 | $4,661 | $179,119 | $22,000 | $157,119 |
| 2020 | $4,596 | $173,392 | $22,000 | $151,392 |
| 2019 | $3,750 | $129,431 | $22,000 | $107,431 |
| 2018 | $3,773 | $129,431 | $22,000 | $107,431 |
| 2017 | $3,565 | $122,555 | $22,000 | $100,555 |
| 2016 | $3,548 | $122,555 | $22,000 | $100,555 |
| 2015 | $3,206 | $113,101 | $22,000 | $91,101 |
| 2014 | $2,958 | $113,101 | $22,000 | $91,101 |
Source: Public Records
Map
Nearby Homes
- 20 Water Oak Dr
- 242 Township Dr
- 135 Graceton Farms Dr
- 106 Graceton Farms Dr
- 42 S Hunter St
- 244 Turin Rd
- 49 Durham Estates Dr
- 546 Linch Rd
- 143 Linchwood Dr
- 165 Durham Estates Dr
- 138 Main St
- 32 Wrightsburg Trail
- 1 Mcintosh Trail
- 95 Old Mill Way Unit 2
- 296 Mcintosh Trail
- 565 Timberbrook Dr
- 2022 Standing Rock Rd
- 0 Johnson Rd Unit LOT 4 10583889
- 0 Johnson Rd Unit LOT 3 10583885
- 0 Bob Smith Rd Unit 10562838
- 12 Red Oak Trail
- 1 White Oak Ln
- 3 White Oak Ln
- 14 Red Oak Trail
- 0 White Oak Ln Unit 50 7221789
- 0 White Oak Ln Unit 50
- 9 Water Oak Dr
- 9 Red Oak Trail
- 9 Red Oak Trail Unit 67
- 6 Red Oak Trail
- 7 Red Oak Trail
- 16 Red Oak Trail
- 5 Red Oak Trail
- 7 Water Oak Dr
- 7 Water Oak Dr Unit 48
- 11 Red Oak Trail
- 11 Red Oak Trail Unit TR
- 18 Red Oak Trail
- 18 Red Oak Trail Unit LOT 55
- 11 Water Oak Dr