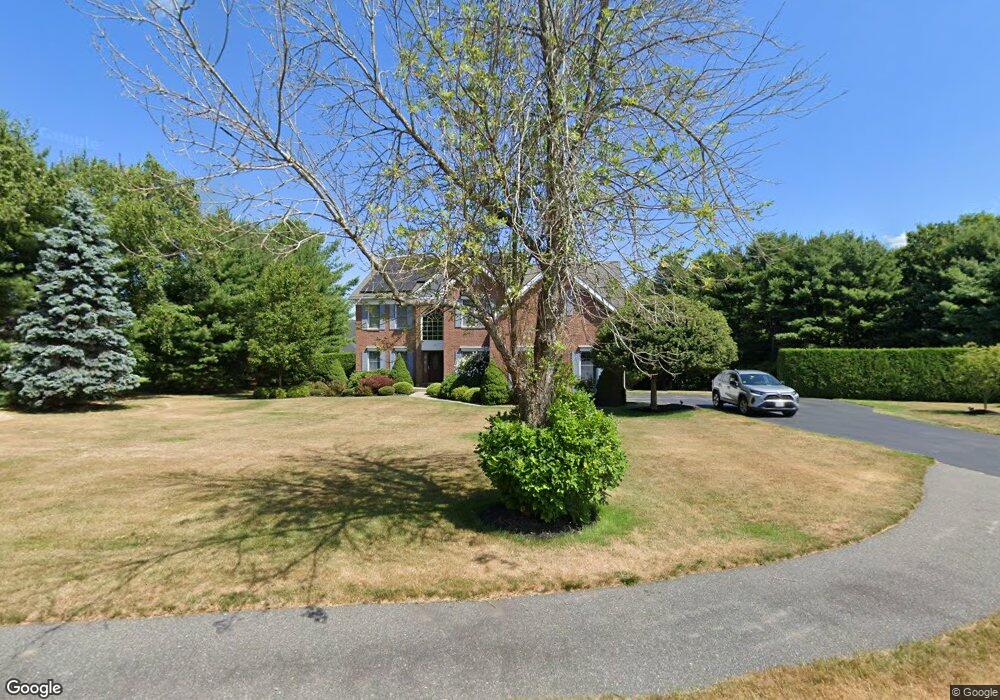
10 Reed Ave Westborough, MA 01581
Estimated Value: $1,268,000 - $1,372,000
4
Beds
3
Baths
4,200
Sq Ft
$313/Sq Ft
Est. Value
About This Home
This home is located at 10 Reed Ave, Westborough, MA 01581 and is currently estimated at $1,315,378, approximately $313 per square foot. 10 Reed Ave is a home located in Worcester County with nearby schools including Westborough High School, Ebridge Montessori School, and Westboro Knowledge Beginnings.
Ownership History
Date
Name
Owned For
Owner Type
Purchase Details
Closed on
Aug 2, 2005
Sold by
Prudential Homes Corp
Bought by
Maria Martin and Maria Maura
Current Estimated Value
Purchase Details
Closed on
Jul 19, 2005
Sold by
Gilicinski Andrew G and Gilicinski Maureen A
Bought by
Prudential Res Svcs Lp
Purchase Details
Closed on
Feb 8, 2001
Sold by
Lynch Edward B and Lynch Eleanor K
Bought by
Gilicinski Andrew G and Gilicinski Maureen A
Purchase Details
Closed on
Jul 22, 1996
Sold by
Valley View Est Lp
Bought by
Lynch Edward B and Lynch Eleanor
Create a Home Valuation Report for This Property
The Home Valuation Report is an in-depth analysis detailing your home's value as well as a comparison with similar homes in the area
Home Values in the Area
Average Home Value in this Area
Purchase History
| Date | Buyer | Sale Price | Title Company |
|---|---|---|---|
| Maria Martin | $737,000 | -- | |
| Prudential Res Svcs Lp | $737,000 | -- | |
| Gilicinski Andrew G | $550,000 | -- | |
| Lynch Edward B | $333,088 | -- |
Source: Public Records
Mortgage History
| Date | Status | Borrower | Loan Amount |
|---|---|---|---|
| Open | Lynch Edward B | $278,000 | |
| Closed | Lynch Edward B | $291,000 | |
| Closed | Lynch Edward B | $293,000 |
Source: Public Records
Tax History Compared to Growth
Tax History
| Year | Tax Paid | Tax Assessment Tax Assessment Total Assessment is a certain percentage of the fair market value that is determined by local assessors to be the total taxable value of land and additions on the property. | Land | Improvement |
|---|---|---|---|---|
| 2025 | $16,497 | $1,012,700 | $377,600 | $635,100 |
| 2024 | $15,232 | $928,200 | $352,800 | $575,400 |
| 2023 | $14,540 | $863,400 | $335,900 | $527,500 |
| 2022 | $13,548 | $732,700 | $271,500 | $461,200 |
| 2021 | $13,269 | $715,700 | $254,500 | $461,200 |
| 2020 | $13,168 | $718,800 | $269,400 | $449,400 |
| 2019 | $12,833 | $700,100 | $265,100 | $435,000 |
| 2018 | $12,137 | $657,500 | $265,100 | $392,400 |
| 2017 | $11,704 | $657,500 | $265,100 | $392,400 |
| 2016 | $11,751 | $661,300 | $265,100 | $396,200 |
| 2015 | $11,303 | $608,000 | $237,600 | $370,400 |
Source: Public Records
Map
Nearby Homes