Estimated Value: $305,000 - $361,000
4
Beds
2
Baths
2,329
Sq Ft
$141/Sq Ft
Est. Value
About This Home
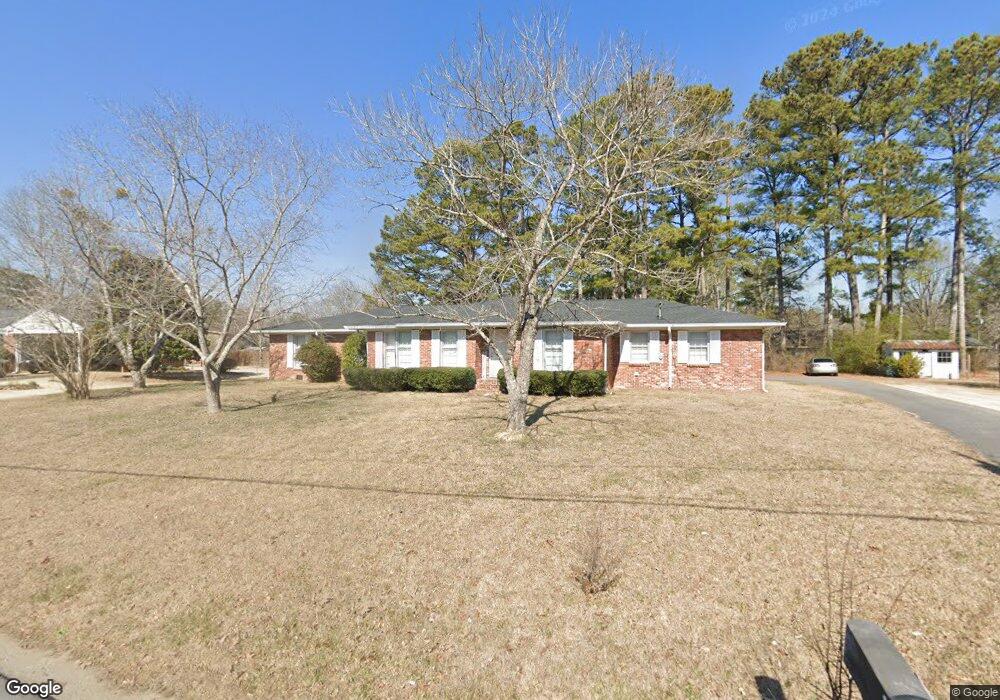
This home is located at 10 Ridge Haven Dr NW Unit 18A, Rome, GA 30165 and is currently estimated at $329,011, approximately $141 per square foot. 10 Ridge Haven Dr NW Unit 18A is a home located in Floyd County with nearby schools including Rome High School.
Ownership History
Date
Name
Owned For
Owner Type
Purchase Details
Closed on
Dec 23, 2019
Sold by
Miller Stephen
Bought by
Mosley Andrew R
Current Estimated Value
Home Financials for this Owner
Home Financials are based on the most recent Mortgage that was taken out on this home.
Original Mortgage
$175,757
Outstanding Balance
$157,899
Interest Rate
4.62%
Mortgage Type
FHA
Estimated Equity
$171,112
Purchase Details
Closed on
Apr 28, 2006
Sold by
Not Provided
Bought by
Miller Stephen
Home Financials for this Owner
Home Financials are based on the most recent Mortgage that was taken out on this home.
Original Mortgage
$110,456
Interest Rate
6.33%
Mortgage Type
New Conventional
Purchase Details
Closed on
Mar 19, 1997
Sold by
Miller John R and Miller Leslie W
Bought by
Franklin Sharon A
Purchase Details
Closed on
Oct 27, 1995
Sold by
Beatty Odell S
Bought by
Miller John R and Miller Leslie W
Purchase Details
Closed on
Aug 30, 1995
Sold by
Beatty Robert K and Beatty Odell S
Bought by
Beatty Odell S
Purchase Details
Closed on
Sep 8, 1993
Bought by
Beatty Robert K and Beatty Odell S
Create a Home Valuation Report for This Property
The Home Valuation Report is an in-depth analysis detailing your home's value as well as a comparison with similar homes in the area
Home Values in the Area
Average Home Value in this Area
Purchase History
| Date | Buyer | Sale Price | Title Company |
|---|---|---|---|
| Mosley Andrew R | $179,000 | -- | |
| Miller Stephen | $110,000 | -- | |
| Franklin Sharon A | $92,500 | -- | |
| Miller John R | $92,500 | -- | |
| Beatty Odell S | -- | -- | |
| Beatty Robert K | $83,000 | -- |
Source: Public Records
Mortgage History
| Date | Status | Borrower | Loan Amount |
|---|---|---|---|
| Open | Mosley Andrew R | $175,757 | |
| Previous Owner | Miller Stephen | $110,456 |
Source: Public Records
Tax History Compared to Growth
Tax History
| Year | Tax Paid | Tax Assessment Tax Assessment Total Assessment is a certain percentage of the fair market value that is determined by local assessors to be the total taxable value of land and additions on the property. | Land | Improvement |
|---|---|---|---|---|
| 2024 | $3,575 | $130,637 | $11,176 | $119,461 |
| 2023 | $3,551 | $116,846 | $10,160 | $106,686 |
| 2022 | $2,980 | $91,306 | $8,128 | $83,178 |
| 2021 | $2,638 | $72,408 | $8,128 | $64,280 |
| 2020 | $2,630 | $75,488 | $6,096 | $69,392 |
| 2019 | $2,059 | $55,614 | $6,096 | $49,518 |
| 2018 | $1,966 | $53,105 | $6,096 | $47,009 |
| 2017 | $1,920 | $51,864 | $6,096 | $45,768 |
| 2016 | $1,985 | $53,440 | $6,080 | $47,360 |
| 2015 | -- | $54,709 | $6,080 | $48,629 |
| 2014 | -- | $54,709 | $6,080 | $48,629 |
Source: Public Records
Map
Nearby Homes
- 8 N Haven Dr
- 8 Ridge Haven Dr NW
- 9 N Haven Dr
- 7 N Haven Dr
- 2 Eugenia Cir NW
- 123 Trentwood Place NW
- 11 Simpson Dr NW
- 8 Tall Pines Terrace NW
- 25 Shoreline Dr NW
- 32 Donley Dr NW
- 33 NW Hunters Glenn Rd
- 3013 Garden Lakes Blvd NW
- 11 Pinestream Dr NW
- 201 Rollingwood Cir NW
- 24 Conway Place NW
- 216 Huffaker Rd NW
- 26 Williamsburg Dr NW
- 31 Williamsburg Dr NW
- 10 Ridge Haven Dr NW
- 12 Ridge Haven Dr NW
- 7 Rollingwood Dr NW
- 5 Rollingwood Dr NW
- 9 Rollingwood Dr NW
- 11 Ridgehaven Dr Unit Sec 18A
- 11 Ridgehaven Dr
- 11 Ridge Haven Dr NW
- 11 Ridge Haven Dr NW Unit Sec 18A
- 0 Ridgehaven Dr Unit 8666073
- 0 Ridgehaven Dr Unit 7206675
- 0 Ridgehaven Dr Unit 7382244
- 0 Ridgehaven Dr Unit 7542704
- 0 Ridgehaven Dr Unit 7612588
- 0 Ridgehaven Dr Unit 8124696
- 0 Ridgehaven Dr Unit 8167707
- 0 Ridgehaven Dr Unit 8226877
- 0 Ridgehaven Dr Unit 8510435
- 0 Ridgehaven Dr
- 9 Ridge Haven Dr NW