Estimated Value: $466,000 - $602,360
5
Beds
4
Baths
4,989
Sq Ft
$111/Sq Ft
Est. Value
About This Home
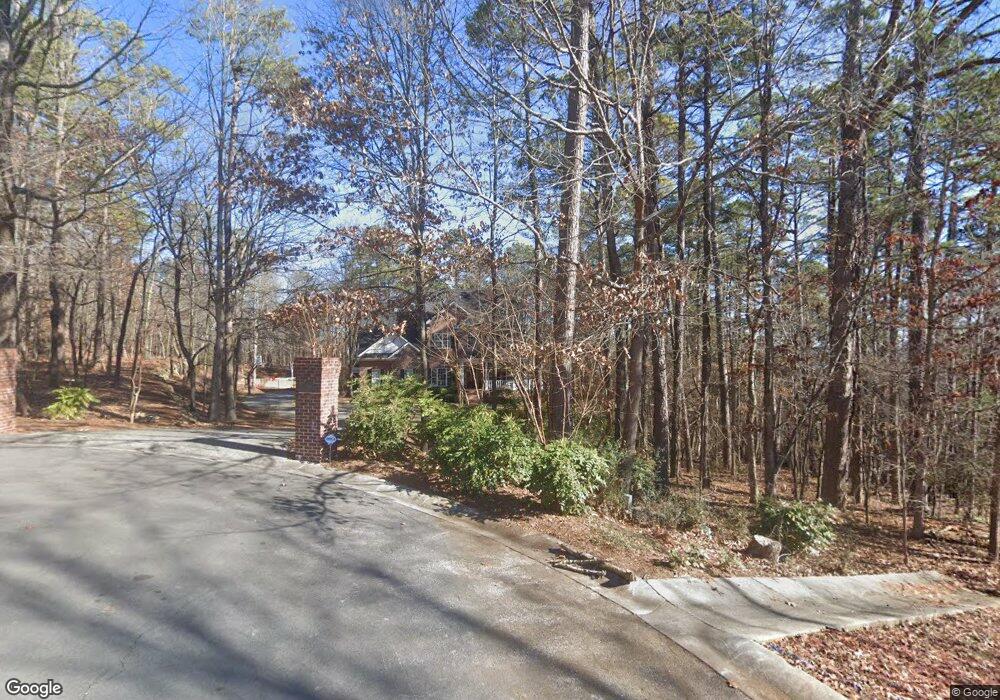
This home is located at 10 Ridgepointe Dr SE, Rome, GA 30161 and is currently estimated at $552,590, approximately $110 per square foot. 10 Ridgepointe Dr SE is a home located in Floyd County with nearby schools including Rome High School, Montessori School of Rome, and St. Mary School.
Ownership History
Date
Name
Owned For
Owner Type
Purchase Details
Closed on
Mar 22, 2011
Sold by
Landrum Vern
Bought by
Landrum Lisa
Current Estimated Value
Purchase Details
Closed on
Jun 26, 2008
Sold by
Not Provided
Bought by
Landrum Lisa
Purchase Details
Closed on
Sep 10, 2001
Sold by
Brinson Robert M and Brinson Tina C
Bought by
Brewster Mark E and Brewster Lauren P
Purchase Details
Closed on
Feb 22, 2000
Bought by
P and R
Purchase Details
Closed on
Oct 16, 1997
Sold by
Shumpert Paul K and Shumpert Cynthia R
Bought by
Collins James E Jr & Jay A Schecter
Purchase Details
Closed on
May 24, 1996
Sold by
Collins James E and Collins Patricia W
Bought by
Shumpert Paul K and Shumper Cynthia R
Purchase Details
Closed on
May 17, 1996
Bought by
P and R
Purchase Details
Closed on
May 19, 1993
Sold by
Childs David L and Childs Deborah J
Bought by
Collins James E and Collins Patricia W
Purchase Details
Closed on
Mar 27, 1992
Sold by
Collins James E Jr & Jay A Schecter
Bought by
Childs David L and Childs Deborah J
Purchase Details
Closed on
Mar 10, 1992
Bought by
Collins James E Jr & Jay A Schecter
Create a Home Valuation Report for This Property
The Home Valuation Report is an in-depth analysis detailing your home's value as well as a comparison with similar homes in the area
Home Values in the Area
Average Home Value in this Area
Purchase History
| Date | Buyer | Sale Price | Title Company |
|---|---|---|---|
| Landrum Lisa | -- | -- | |
| Landrum Lisa | $460,000 | -- | |
| Landrum Vern | $460,000 | -- | |
| Brewster Mark E | $39,800 | -- | |
| P | -- | -- | |
| P | -- | -- | |
| Brinson Robert M | $55,000 | -- | |
| Collins James E Jr & Jay A Schecter | $50,000 | -- | |
| Shumpert Paul K | $48,000 | -- | |
| P | $26,300 | -- | |
| Collins James E | -- | -- | |
| Childs David L | $26,300 | -- | |
| Collins James E Jr & Jay A Schecter | $105,000 | -- |
Source: Public Records
Tax History Compared to Growth
Tax History
| Year | Tax Paid | Tax Assessment Tax Assessment Total Assessment is a certain percentage of the fair market value that is determined by local assessors to be the total taxable value of land and additions on the property. | Land | Improvement |
|---|---|---|---|---|
| 2024 | $6,876 | $225,411 | $10,920 | $214,491 |
| 2023 | $6,793 | $219,468 | $10,920 | $208,548 |
| 2022 | $6,360 | $188,749 | $10,400 | $178,349 |
| 2021 | $6,087 | $170,816 | $10,400 | $160,416 |
| 2020 | $5,749 | $154,979 | $10,400 | $144,579 |
| 2019 | $5,447 | $148,444 | $10,400 | $138,044 |
| 2018 | $5,202 | $141,815 | $10,400 | $131,415 |
| 2017 | $4,236 | $136,100 | $10,400 | $125,700 |
| 2016 | $4,936 | $134,200 | $10,400 | $123,800 |
| 2015 | $4,563 | $131,394 | $10,400 | $120,994 |
| 2014 | $4,563 | $131,394 | $10,400 | $120,994 |
Source: Public Records
Map
Nearby Homes
- 20 Coventry Dr SE
- 22 Coventry Dr SE
- 35 Cumberland Dr SE
- 119 Chateau Dr SE
- 113 Chateau Dr SE
- 38 Coventry Dr SE
- 36 Coventry Dr SE
- 211 Chateau Dr SE
- 18 Wellington Way SE
- 14 Wellington Way SE
- 2107 Rockmart Rd SE
- 15 Saddlebrook Dr SE
- 3 Belmont Ct SE
- 263 Mountain View Rd SE
- 145 Mountain View Rd SE
- 115 Hawthorne St SE
- 11 Cambridge Dr SE
- 6 Ridgepointe Dr SE
- 4 Ridgepointe Dr SE
- 5 Ridgepointe Dr SE
- 5 Ridgepointe Dr SE
- 3 Ridgepointe Dr SE
- 6 Coventry Dr SE
- 4 Coventry Dr SE
- 10 Cumberland Dr SE
- 12 Cumberland Dr SE
- 8 Coventry Dr SE
- 14 Cumberland Dr SE
- 8 Cumberland Dr SE
- 10 Coventry Dr SE
- 6 Cumberland Dr SE
- 5 Coventry Dr SE Unit 12
- 5 Coventry Dr SE
- 3 Coventry Dr SE
- 16 Cumberland Dr SE
- 7 Cumberland Dr SE
- 7 Coventry Dr SE Unit 13