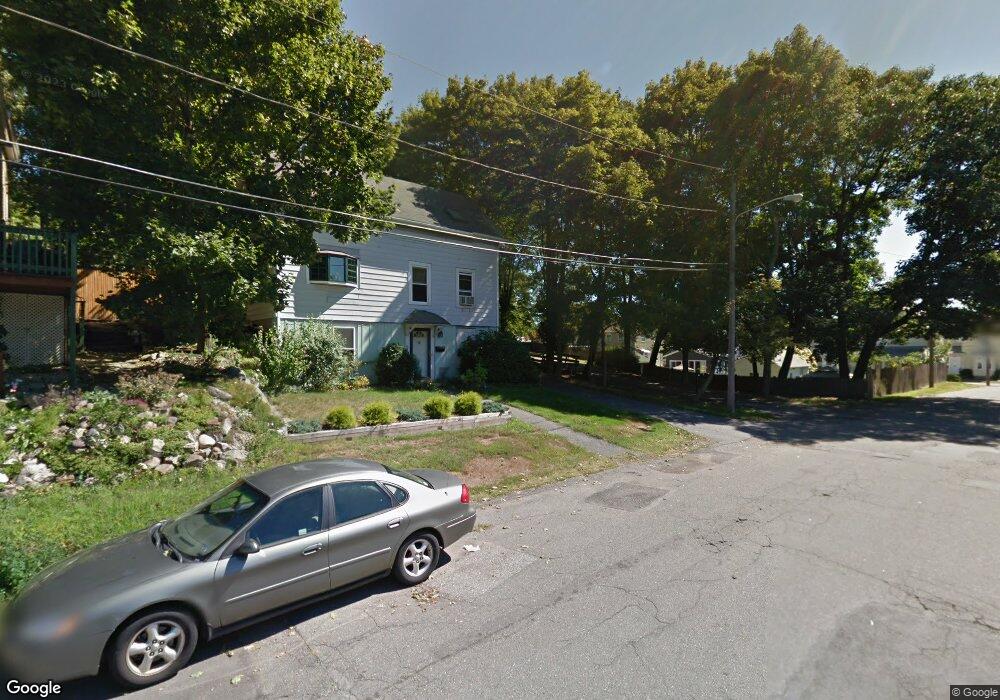
10 Roanoke St Unit 1 Quincy, MA 02169
Germantown NeighborhoodEstimated Value: $389,000 - $444,000
3
Beds
1
Bath
748
Sq Ft
$569/Sq Ft
Est. Value
About This Home
This home is located at 10 Roanoke St Unit 1, Quincy, MA 02169 and is currently estimated at $425,857, approximately $569 per square foot. 10 Roanoke St Unit 1 is a home located in Norfolk County with nearby schools including Snug Harbor Community School, Broad Meadows Middle School, and Quincy High School.
Ownership History
Date
Name
Owned For
Owner Type
Purchase Details
Closed on
Mar 22, 2024
Sold by
Kelly Louise C Est and Kelly
Bought by
Diaz Richard
Current Estimated Value
Home Financials for this Owner
Home Financials are based on the most recent Mortgage that was taken out on this home.
Original Mortgage
$338,751
Outstanding Balance
$333,127
Interest Rate
6.64%
Mortgage Type
FHA
Estimated Equity
$92,730
Purchase Details
Closed on
Apr 20, 1977
Bought by
Kelly Louise C
Create a Home Valuation Report for This Property
The Home Valuation Report is an in-depth analysis detailing your home's value as well as a comparison with similar homes in the area
Home Values in the Area
Average Home Value in this Area
Purchase History
| Date | Buyer | Sale Price | Title Company |
|---|---|---|---|
| Diaz Richard | $345,000 | None Available | |
| Kelly Louise C | $16,000 | -- |
Source: Public Records
Mortgage History
| Date | Status | Borrower | Loan Amount |
|---|---|---|---|
| Open | Diaz Richard | $338,751 |
Source: Public Records
Tax History Compared to Growth
Tax History
| Year | Tax Paid | Tax Assessment Tax Assessment Total Assessment is a certain percentage of the fair market value that is determined by local assessors to be the total taxable value of land and additions on the property. | Land | Improvement |
|---|---|---|---|---|
| 2025 | $4,045 | $350,800 | $211,700 | $139,100 |
| 2024 | $3,979 | $353,100 | $211,700 | $141,400 |
| 2023 | $3,732 | $335,300 | $192,500 | $142,800 |
| 2022 | $3,316 | $276,800 | $148,100 | $128,700 |
| 2021 | $3,019 | $248,700 | $128,700 | $120,000 |
| 2020 | $2,993 | $240,800 | $143,100 | $97,700 |
| 2019 | $2,791 | $222,400 | $131,300 | $91,100 |
| 2018 | $2,793 | $209,400 | $125,000 | $84,400 |
| 2017 | $2,664 | $188,000 | $113,600 | $74,400 |
| 2016 | $2,790 | $194,300 | $126,300 | $68,000 |
| 2015 | $2,565 | $175,700 | $114,800 | $60,900 |
| 2014 | $2,384 | $160,400 | $104,400 | $56,000 |
Source: Public Records
Map
Nearby Homes