Estimated Value: $941,000 - $1,202,000
4
Beds
3
Baths
3,418
Sq Ft
$318/Sq Ft
Est. Value
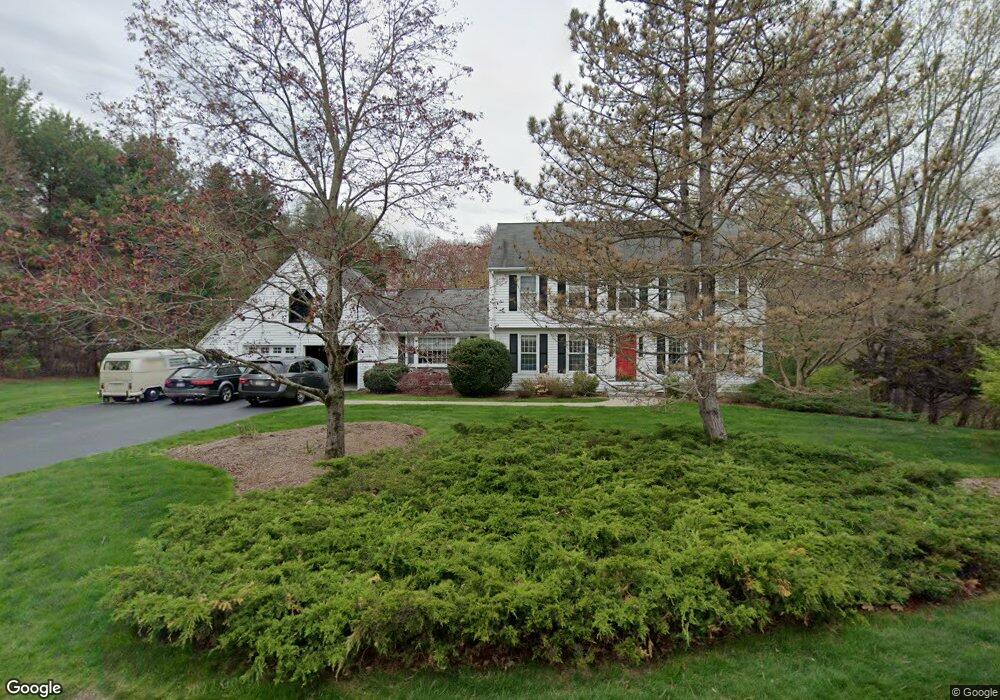
About This Home
This home is located at 10 Robert Rd, Acton, MA 01720 and is currently estimated at $1,086,812, approximately $317 per square foot. 10 Robert Rd is a home located in Middlesex County with nearby schools including Acton-Boxborough Regional High School, Maynard Knowledge Beginnings, and The Imago School.
Ownership History
Date
Name
Owned For
Owner Type
Purchase Details
Closed on
Mar 15, 2018
Sold by
Hultstrom Dennis E and Hultstrom Dianne V
Bought by
Dehdvh Rt
Current Estimated Value
Purchase Details
Closed on
Sep 29, 2010
Sold by
Gettig Thomas E and Gettig Judith A
Bought by
Gettig Tr Judith A and Gettig Thomas E
Create a Home Valuation Report for This Property
The Home Valuation Report is an in-depth analysis detailing your home's value as well as a comparison with similar homes in the area
Home Values in the Area
Average Home Value in this Area
Purchase History
| Date | Buyer | Sale Price | Title Company |
|---|---|---|---|
| Dehdvh Rt | -- | -- | |
| Gettig Tr Judith A | -- | -- |
Source: Public Records
Tax History
| Year | Tax Paid | Tax Assessment Tax Assessment Total Assessment is a certain percentage of the fair market value that is determined by local assessors to be the total taxable value of land and additions on the property. | Land | Improvement |
|---|---|---|---|---|
| 2025 | $16,354 | $953,600 | $358,300 | $595,300 |
| 2024 | $15,413 | $924,600 | $358,300 | $566,300 |
| 2023 | $15,038 | $856,400 | $325,800 | $530,600 |
| 2022 | $14,434 | $742,100 | $283,000 | $459,100 |
| 2021 | $14,098 | $696,900 | $262,200 | $434,700 |
| 2020 | $13,291 | $690,800 | $262,200 | $428,600 |
| 2019 | $12,740 | $657,700 | $262,200 | $395,500 |
| 2018 | $12,791 | $660,000 | $262,200 | $397,800 |
| 2017 | $12,456 | $653,500 | $262,200 | $391,300 |
| 2016 | $12,192 | $634,000 | $262,200 | $371,800 |
| 2015 | $11,954 | $627,500 | $262,200 | $365,300 |
| 2014 | $11,907 | $612,200 | $262,200 | $350,000 |
Source: Public Records
Map
Nearby Homes
- 63 Conant St
- 1 Drummer Rd Unit A5
- 36 Brown St
- 70 Powder Mill Rd
- 128 Parker St Unit 3B
- 68 Powder Mill Rd
- 66 Powder Mill Rd
- 31 Drummer Rd Unit 31
- 12 Brown St
- 30 Brewster Ln
- 23 Deer Path Unit 5
- 40 High St
- 1 Vanderbelt Rd
- 96 Forest Ridge Rd Unit 96
- 70 River St
- 7 Hillcrest Dr
- 22 Douglas Ave Unit 2
- 22 Douglas Ave Unit 1
- 5 Hayes St Unit 5
- 13 Arthur St Unit 15
Your Personal Tour Guide
Ask me questions while you tour the home.