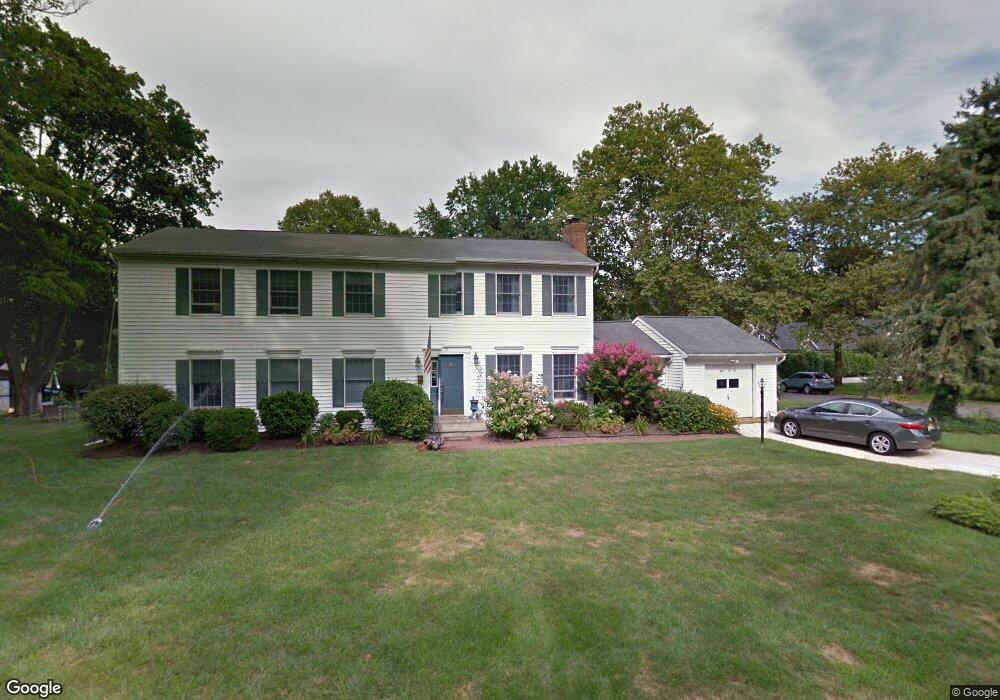
10 Robin Rd Rumson, NJ 07760
Estimated Value: $1,968,000 - $2,640,000
5
Beds
2
Baths
2,846
Sq Ft
$777/Sq Ft
Est. Value
About This Home
This home is located at 10 Robin Rd, Rumson, NJ 07760 and is currently estimated at $2,210,876, approximately $776 per square foot. 10 Robin Rd is a home located in Monmouth County with nearby schools including Deane Porter School, Forrestdale School, and Rumson Fair Haven Regional High School.
Ownership History
Date
Name
Owned For
Owner Type
Purchase Details
Closed on
May 23, 2024
Sold by
Herrlich Marylee and Herrlich William F
Bought by
Herrlich William F and Herrlich Mary Lee
Current Estimated Value
Create a Home Valuation Report for This Property
The Home Valuation Report is an in-depth analysis detailing your home's value as well as a comparison with similar homes in the area
Home Values in the Area
Average Home Value in this Area
Purchase History
| Date | Buyer | Sale Price | Title Company |
|---|---|---|---|
| Herrlich William F | -- | None Listed On Document | |
| Herrlich William F | -- | None Listed On Document |
Source: Public Records
Tax History
| Year | Tax Paid | Tax Assessment Tax Assessment Total Assessment is a certain percentage of the fair market value that is determined by local assessors to be the total taxable value of land and additions on the property. | Land | Improvement |
|---|---|---|---|---|
| 2025 | $18,464 | $1,814,300 | $1,278,900 | $535,400 |
| 2024 | $17,899 | $1,678,500 | $1,191,300 | $487,200 |
| 2023 | $17,899 | $1,531,100 | $1,137,200 | $393,900 |
| 2022 | $17,050 | $1,369,600 | $999,600 | $370,000 |
| 2021 | $17,050 | $1,198,200 | $844,300 | $353,900 |
| 2020 | $17,258 | $1,204,300 | $863,000 | $341,300 |
| 2019 | $15,853 | $1,079,200 | $656,400 | $422,800 |
| 2018 | $15,278 | $1,030,900 | $656,400 | $374,500 |
| 2017 | $14,976 | $1,019,500 | $656,400 | $363,100 |
| 2016 | $14,478 | $1,010,300 | $656,400 | $353,900 |
| 2015 | $14,449 | $994,400 | $656,400 | $338,000 |
| 2014 | $14,354 | $985,200 | $656,400 | $328,800 |
Source: Public Records
Map
Nearby Homes
- 61 Center St
- 132 Avenue of Two Rivers
- 2 Tulip Tree Ln
- 143 Bingham Ave
- 14 Ridge Rd
- 121 Black Point Rd
- 24 Bingham Ct
- 13 Bingham Ct
- 11 Bingham Ct
- 26 Bingham Ct
- 22 Rosalie Ave
- 12 Parmly St
- 19 Maplewood Ave
- 18 Meadowbrook Ave
- 7 Belknap Ln
- 50 Rumson Rd
- 0 Tennis Court Ln
- 90 Washington St
- 80 Bingham Ave
- 8 Black Point Horseshoe
Your Personal Tour Guide
Ask me questions while you tour the home.