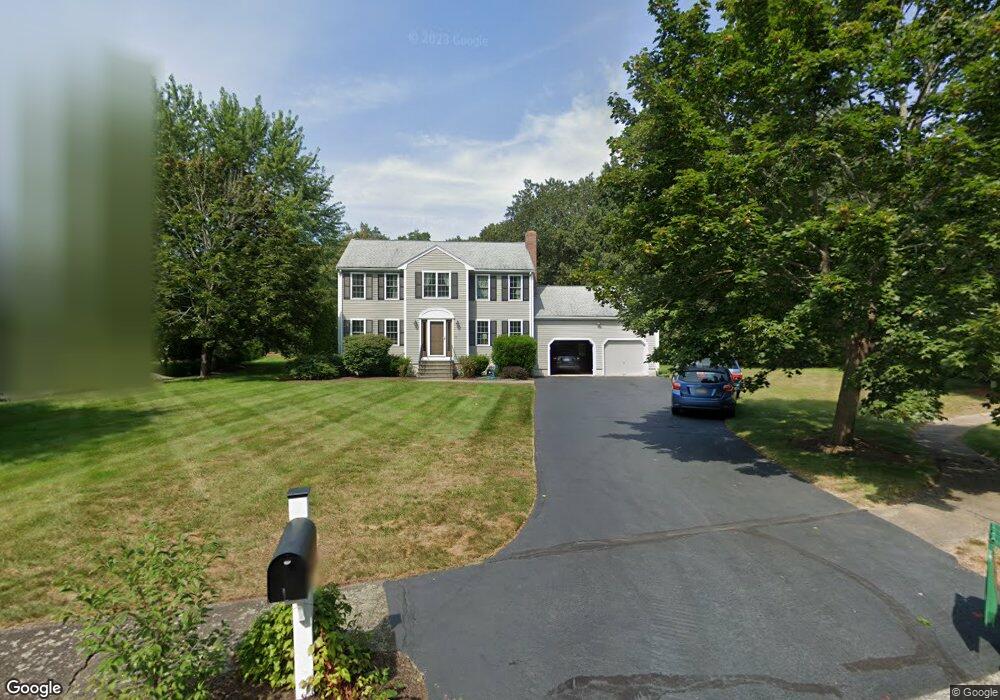
10 Robinson Ct Mansfield, MA 02048
Estimated Value: $869,792 - $984,000
4
Beds
3
Baths
2,464
Sq Ft
$386/Sq Ft
Est. Value
About This Home
This home is located at 10 Robinson Ct, Mansfield, MA 02048 and is currently estimated at $950,948, approximately $385 per square foot. 10 Robinson Ct is a home located in Bristol County with nearby schools including Everett W. Robinson Elementary School, Jordan/Jackson Elementary School, and Harold L. Qualters Middle School.
Ownership History
Date
Name
Owned For
Owner Type
Purchase Details
Closed on
Jul 25, 1997
Sold by
Gillespie Kevin M and Gillespie Jasper-Gillespie L
Bought by
Melton Tim R and Melton Lisa L
Current Estimated Value
Purchase Details
Closed on
Jul 15, 1996
Sold by
Omalley Michael P
Bought by
Gillespie Kevin M and Gillespie Lianne J
Purchase Details
Closed on
Sep 7, 1995
Sold by
Robinson Court Rt
Bought by
Omalley Michael P
Purchase Details
Closed on
Nov 7, 1994
Sold by
Wading River Rt
Bought by
Aiello Joseph
Create a Home Valuation Report for This Property
The Home Valuation Report is an in-depth analysis detailing your home's value as well as a comparison with similar homes in the area
Home Values in the Area
Average Home Value in this Area
Purchase History
| Date | Buyer | Sale Price | Title Company |
|---|---|---|---|
| Melton Tim R | $237,500 | -- | |
| Gillespie Kevin M | $226,500 | -- | |
| Omalley Michael P | $220,000 | -- | |
| Aiello Joseph | $62,500 | -- |
Source: Public Records
Mortgage History
| Date | Status | Borrower | Loan Amount |
|---|---|---|---|
| Closed | Aiello Joseph | $180,000 | |
| Closed | Aiello Joseph | $176,000 | |
| Closed | Aiello Joseph | $25,000 |
Source: Public Records
Tax History
| Year | Tax Paid | Tax Assessment Tax Assessment Total Assessment is a certain percentage of the fair market value that is determined by local assessors to be the total taxable value of land and additions on the property. | Land | Improvement |
|---|---|---|---|---|
| 2025 | $9,812 | $745,000 | $279,900 | $465,100 |
| 2024 | $9,690 | $717,800 | $292,100 | $425,700 |
| 2023 | $9,359 | $664,200 | $292,100 | $372,100 |
| 2022 | $8,979 | $591,900 | $270,400 | $321,500 |
| 2021 | $4,640 | $572,700 | $225,400 | $347,300 |
| 2020 | $8,655 | $563,500 | $225,400 | $338,100 |
| 2019 | $8,050 | $528,900 | $187,700 | $341,200 |
| 2018 | $4,163 | $514,200 | $179,100 | $335,100 |
| 2017 | $7,508 | $499,900 | $174,000 | $325,900 |
| 2016 | $7,147 | $463,800 | $165,600 | $298,200 |
| 2015 | $6,955 | $448,700 | $165,600 | $283,100 |
Source: Public Records
Map
Nearby Homes
- 128 Tremont St
- 24 Maverick Dr
- 17 Childs Ln
- 25 Shepherd St
- 1769 West St
- 150 Gilbert St
- 14 Claire Ave
- 401 South St
- 40 Treasure Island Rd
- 9 Coach Rd
- 84 Messenger St
- 16 Treasure Island Rd
- 33 Colonial Way
- 25 Munroe Dr
- 346 South St
- 46 Mirimichi St
- 38 Mirimichi St
- 28 Messenger St
- 115 Westfield Dr
- 2 Oak St Unit 2B
Your Personal Tour Guide
Ask me questions while you tour the home.