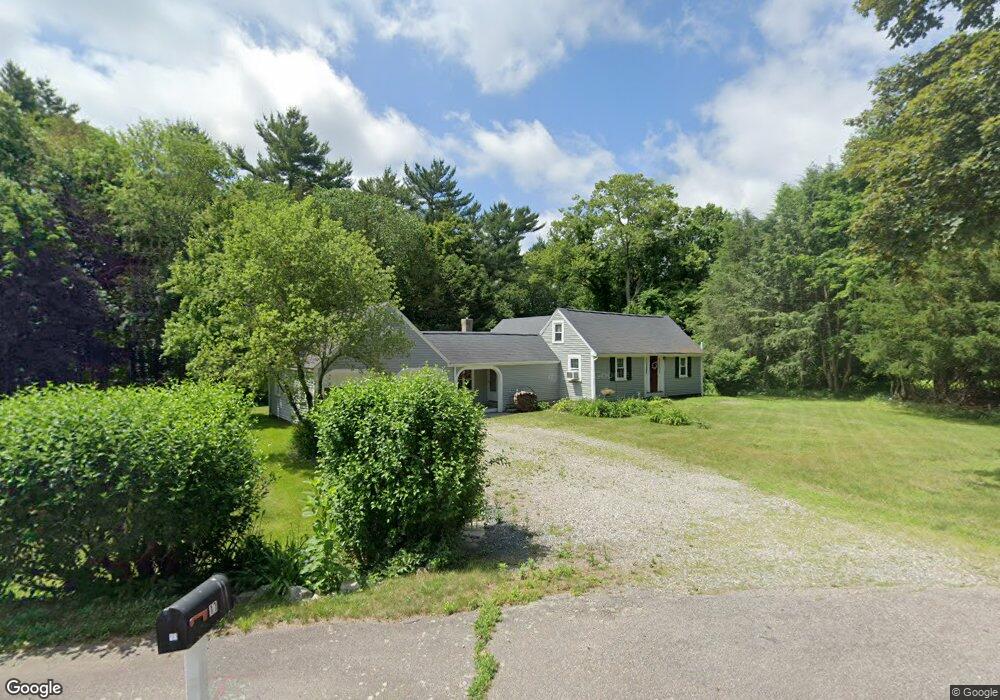
10 Robyn Ln Unit 1 Mansfield, MA 02048
Estimated Value: $656,680 - $799,000
3
Beds
2
Baths
1,513
Sq Ft
$466/Sq Ft
Est. Value
About This Home
This home is located at 10 Robyn Ln Unit 1, Mansfield, MA 02048 and is currently estimated at $705,670, approximately $466 per square foot. 10 Robyn Ln Unit 1 is a home located in Bristol County with nearby schools including Jordan/Jackson Elementary School, Everett W. Robinson Elementary School, and Harold L. Qualters Middle School.
Ownership History
Date
Name
Owned For
Owner Type
Purchase Details
Closed on
Jul 15, 2019
Sold by
Hagg Elizabeth R and Saquet Robert J
Bought by
Hagg Elizabeth R
Current Estimated Value
Purchase Details
Closed on
Mar 31, 2009
Sold by
Lopolito Thomas
Bought by
Saquet Robert J and Saquet Elizabeth R
Home Financials for this Owner
Home Financials are based on the most recent Mortgage that was taken out on this home.
Original Mortgage
$265,000
Interest Rate
5.14%
Mortgage Type
Purchase Money Mortgage
Purchase Details
Closed on
Sep 28, 2007
Sold by
Moyer Christopher A and Moyer Robyn
Bought by
Lopolito Thomas
Home Financials for this Owner
Home Financials are based on the most recent Mortgage that was taken out on this home.
Original Mortgage
$145,000
Interest Rate
6.65%
Mortgage Type
Purchase Money Mortgage
Purchase Details
Closed on
Apr 28, 2004
Sold by
Karpawich Kirsten and Karpawich Paul
Bought by
Moyer Christopher A and Moyer Robyn
Home Financials for this Owner
Home Financials are based on the most recent Mortgage that was taken out on this home.
Original Mortgage
$320,000
Interest Rate
5.36%
Mortgage Type
Purchase Money Mortgage
Purchase Details
Closed on
Nov 3, 1998
Sold by
Skene Alexander J and Johnston Sara C
Bought by
Karpawich Paul and Karpawich Kirsten
Home Financials for this Owner
Home Financials are based on the most recent Mortgage that was taken out on this home.
Original Mortgage
$197,600
Interest Rate
6.68%
Mortgage Type
Purchase Money Mortgage
Purchase Details
Closed on
Nov 2, 1998
Sold by
Skene Alexander J and Johnston Sara C
Bought by
Karpawich Paul and Karpawich Kirsten
Home Financials for this Owner
Home Financials are based on the most recent Mortgage that was taken out on this home.
Original Mortgage
$197,600
Interest Rate
6.68%
Mortgage Type
Purchase Money Mortgage
Purchase Details
Closed on
Jul 23, 1993
Sold by
K & A Rt
Bought by
Skene Aleander J and Johnson Sara C
Create a Home Valuation Report for This Property
The Home Valuation Report is an in-depth analysis detailing your home's value as well as a comparison with similar homes in the area
Home Values in the Area
Average Home Value in this Area
Purchase History
| Date | Buyer | Sale Price | Title Company |
|---|---|---|---|
| Hagg Elizabeth R | -- | -- | |
| Saquet Robert J | $345,000 | -- | |
| Lopolito Thomas | $371,000 | -- | |
| Moyer Christopher A | $400,000 | -- | |
| Karpawich Paul | $247,000 | -- | |
| Karpawich Paul | $247,000 | -- | |
| Skene Aleander J | $45,000 | -- |
Source: Public Records
Mortgage History
| Date | Status | Borrower | Loan Amount |
|---|---|---|---|
| Previous Owner | Saquet Robert J | $265,000 | |
| Previous Owner | Karpawich Paul | $145,000 | |
| Previous Owner | Moyer Christopher A | $320,000 | |
| Previous Owner | Karpawich Paul | $196,000 | |
| Previous Owner | Karpawich Paul | $197,600 | |
| Previous Owner | Karpawich Paul | $197,600 |
Source: Public Records
Tax History Compared to Growth
Tax History
| Year | Tax Paid | Tax Assessment Tax Assessment Total Assessment is a certain percentage of the fair market value that is determined by local assessors to be the total taxable value of land and additions on the property. | Land | Improvement |
|---|---|---|---|---|
| 2025 | $7,589 | $576,200 | $286,400 | $289,800 |
| 2024 | $7,826 | $579,700 | $298,800 | $280,900 |
| 2023 | $7,638 | $542,100 | $298,800 | $243,300 |
| 2022 | $7,552 | $497,800 | $276,700 | $221,100 |
| 2021 | $6,706 | $436,600 | $230,600 | $206,000 |
| 2020 | $6,295 | $409,800 | $230,600 | $179,200 |
| 2019 | $6,056 | $397,900 | $192,000 | $205,900 |
| 2018 | $4,860 | $380,200 | $183,300 | $196,900 |
| 2017 | $5,580 | $371,500 | $178,100 | $193,400 |
| 2016 | $5,420 | $351,700 | $169,400 | $182,300 |
| 2015 | $5,217 | $336,600 | $169,400 | $167,200 |
Source: Public Records
Map
Nearby Homes
- 261 East St
- 5 Lauren Ln
- 25 Winter St
- 55-57 Pine Needle Ln
- 130 Morse St
- 3 Cushing Ln
- 12 Community Way
- 35 Independence Dr Unit 35
- 5 Pineview Terrace
- 9 Independence Dr Unit 9
- 124 E Belcher Rd
- 631 East St Unit H102
- 631 East St Unit B102
- 631 East St Unit E101
- 2 Red Fox Run
- 260 Massapoag Ave
- 10 Erick Rd Unit 34
- 4 Shadybrook Ln
- 132 Cannon Forge Dr
- 82 Brook St