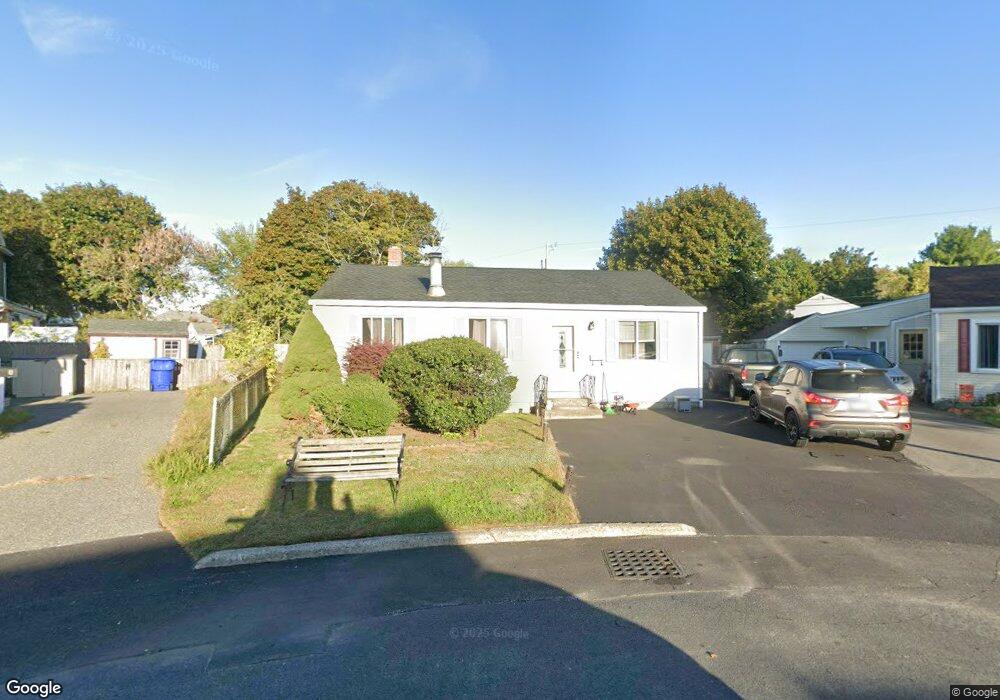
10 Rose Dr Pawtucket, RI 02861
Darlington NeighborhoodEstimated Value: $322,000 - $393,000
1
Bed
1
Bath
1,410
Sq Ft
$256/Sq Ft
Est. Value
About This Home
This home is located at 10 Rose Dr, Pawtucket, RI 02861 and is currently estimated at $360,403, approximately $255 per square foot. 10 Rose Dr is a home located in Providence County with nearby schools including Blackstone Valley Prep Elementary School 2, St Cecilia School, and Saint Raphael Academy.
Ownership History
Date
Name
Owned For
Owner Type
Purchase Details
Closed on
May 28, 2010
Sold by
Couto Richard A and Couto Susan L
Bought by
Mccann Arthur R
Current Estimated Value
Home Financials for this Owner
Home Financials are based on the most recent Mortgage that was taken out on this home.
Original Mortgage
$112,818
Outstanding Balance
$75,623
Interest Rate
5.13%
Mortgage Type
Purchase Money Mortgage
Estimated Equity
$284,780
Purchase Details
Closed on
Aug 25, 2000
Sold by
Levesque Albert and Levesque Jeanette M
Bought by
Couto Richard A and Couto Susan L
Create a Home Valuation Report for This Property
The Home Valuation Report is an in-depth analysis detailing your home's value as well as a comparison with similar homes in the area
Home Values in the Area
Average Home Value in this Area
Purchase History
| Date | Buyer | Sale Price | Title Company |
|---|---|---|---|
| Mccann Arthur R | $114,900 | -- | |
| Couto Richard A | $85,000 | -- |
Source: Public Records
Mortgage History
| Date | Status | Borrower | Loan Amount |
|---|---|---|---|
| Open | Couto Richard A | $112,818 | |
| Previous Owner | Couto Richard A | $210,600 | |
| Previous Owner | Couto Richard A | $30,000 | |
| Previous Owner | Couto Richard A | $110,468 |
Source: Public Records
Tax History
| Year | Tax Paid | Tax Assessment Tax Assessment Total Assessment is a certain percentage of the fair market value that is determined by local assessors to be the total taxable value of land and additions on the property. | Land | Improvement |
|---|---|---|---|---|
| 2025 | $3,532 | $268,600 | $124,100 | $144,500 |
| 2024 | $3,315 | $268,600 | $124,100 | $144,500 |
| 2023 | $3,280 | $193,600 | $77,600 | $116,000 |
| 2022 | $3,210 | $193,600 | $77,600 | $116,000 |
| 2021 | $3,210 | $193,600 | $77,600 | $116,000 |
| 2020 | $3,044 | $145,700 | $61,300 | $84,400 |
| 2019 | $3,044 | $145,700 | $61,300 | $84,400 |
| 2018 | $2,933 | $145,700 | $61,300 | $84,400 |
| 2017 | $2,692 | $118,500 | $50,400 | $68,100 |
| 2016 | $2,594 | $118,500 | $50,400 | $68,100 |
| 2015 | $2,594 | $118,500 | $50,400 | $68,100 |
| 2014 | $2,389 | $103,600 | $50,400 | $53,200 |
Source: Public Records
Map
Nearby Homes
- 79 Turner St
- 386 Mendon Ave
- 37 Turner St
- 179 Columbine Ave
- 215 Kenyon Ave
- 735 Broadway
- 39 John St
- 61 Mendon Rd
- 27 Collins Ave
- 40 Linton St
- 362 Kenyon Ave
- 39 Webster St Unit 204
- 50 Pullman Ave Unit A
- 50 Pullman Ave Unit B
- 67 Norton St
- 18 Newton St
- 58 Baltic St Unit 58
- 56 Baltic St Unit 56
- 91 Greenwich St
- 54 Baltic St Unit 54
Your Personal Tour Guide
Ask me questions while you tour the home.