Estimated Value: $1,714,088 - $2,771,000
4
Beds
2
Baths
1,806
Sq Ft
$1,256/Sq Ft
Est. Value
About This Home
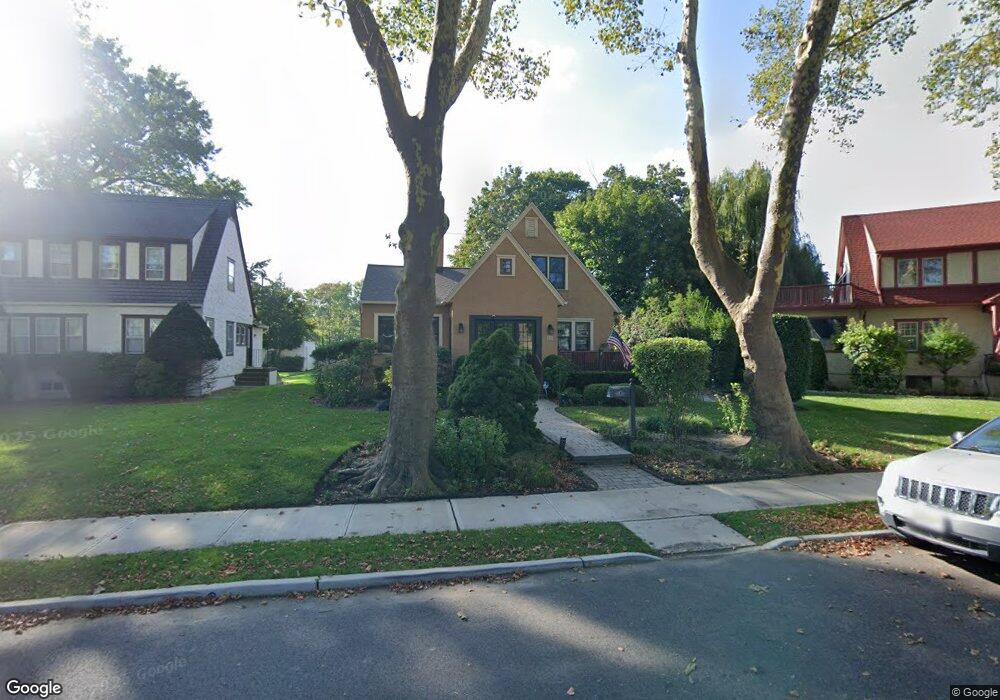
This home is located at 10 Roseld Ct, Deal, NJ 07723 and is currently estimated at $2,268,022, approximately $1,255 per square foot. 10 Roseld Ct is a home located in Monmouth County with nearby schools including Deal Elementary School, Hope Academy Charter School, and St. Mary of the Assumption School.
Ownership History
Date
Name
Owned For
Owner Type
Purchase Details
Closed on
Feb 10, 2023
Sold by
Lauricella Jacki
Bought by
Bishop Michael W and Bishop Pamela S
Current Estimated Value
Purchase Details
Closed on
Feb 18, 2022
Sold by
Ryan Donald J and Ryan Mary
Bought by
69 Fifth Street Llc
Purchase Details
Closed on
Feb 4, 2022
Sold by
Peter Kopels
Bought by
28 2Nd Street Llc
Purchase Details
Closed on
Nov 17, 2021
Sold by
Blasco Vincent and Blasco Emilia
Bought by
Esoldi Albert
Home Financials for this Owner
Home Financials are based on the most recent Mortgage that was taken out on this home.
Original Mortgage
$168,000
Interest Rate
3.14%
Mortgage Type
New Conventional
Purchase Details
Closed on
May 27, 2021
Sold by
Chingli Yang
Bought by
Wacewicz Monica and Demaio Joseph
Create a Home Valuation Report for This Property
The Home Valuation Report is an in-depth analysis detailing your home's value as well as a comparison with similar homes in the area
Home Values in the Area
Average Home Value in this Area
Purchase History
| Date | Buyer | Sale Price | Title Company |
|---|---|---|---|
| Bishop Michael W | $339,900 | Acres Land Title | |
| Bishop Michael W | $339,900 | Acres Land Title | |
| 69 Fifth Street Llc | $290,000 | Allen Richard J | |
| 28 2Nd Street Llc | $180,000 | National Title | |
| Esoldi Albert | $210,000 | Catic Title | |
| Wacewicz Monica | $274,000 | Trident Abstract Title |
Source: Public Records
Mortgage History
| Date | Status | Borrower | Loan Amount |
|---|---|---|---|
| Previous Owner | Esoldi Albert | $168,000 |
Source: Public Records
Tax History Compared to Growth
Tax History
| Year | Tax Paid | Tax Assessment Tax Assessment Total Assessment is a certain percentage of the fair market value that is determined by local assessors to be the total taxable value of land and additions on the property. | Land | Improvement |
|---|---|---|---|---|
| 2025 | $5,352 | $1,439,000 | $1,035,000 | $404,000 |
| 2024 | $5,268 | $1,253,300 | $890,900 | $362,400 |
| 2023 | $5,268 | $1,145,300 | $829,900 | $315,400 |
| 2022 | $5,834 | $871,300 | $649,800 | $221,500 |
| 2021 | $3,848 | $936,000 | $657,700 | $278,300 |
| 2020 | $4,237 | $593,400 | $234,600 | $358,800 |
| 2019 | $4,098 | $578,000 | $221,300 | $356,700 |
| 2018 | $3,589 | $553,100 | $221,300 | $331,800 |
| 2017 | $4,026 | $577,600 | $256,100 | $321,500 |
| 2016 | $3,752 | $536,700 | $239,300 | $297,400 |
| 2015 | $3,492 | $523,300 | $239,300 | $284,000 |
| 2014 | $3,017 | $457,500 | $242,600 | $214,900 |
Source: Public Records
Map
Nearby Homes
- 10 Campbell Ct
- 160 Ocean Ave
- 116 Phillips Ave
- 18 Lady Bess Dr
- 48 Hathaway Ave
- 408 Crosby Ave
- 103 Poplar Ave
- 1 Country Club Dr
- 460 Runyan Ave
- 567 Deal Pkwy
- 510 Blanchard Pkwy
- 127 Cedar Ave
- 504 Crosby Ave
- 222 Cedar Ave
- 48 Neptune Ave
- 104 Lake Dr
- 309 Spier Ave
- 608 Wildwood Rd
- 0 Overbrook Ave
- 328 Elberon Blvd