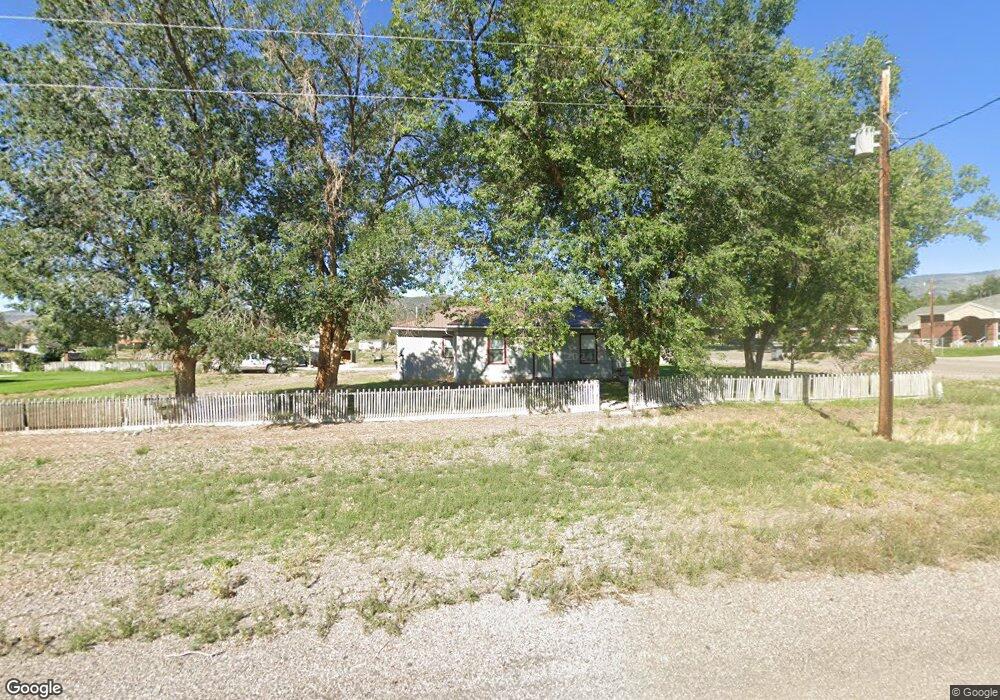
10 S 100 E Koosharem, UT 84744
Estimated Value: $191,985 - $396,000
Studio
--
Bath
821
Sq Ft
$376/Sq Ft
Est. Value
About This Home
This home is located at 10 S 100 E, Koosharem, UT 84744 and is currently estimated at $308,996, approximately $376 per square foot. 10 S 100 E is a home with nearby schools including Koosharem Elementary School, South Sevier Middle School, and South Sevier High School.
Ownership History
Date
Name
Owned For
Owner Type
Purchase Details
Closed on
Apr 27, 2016
Sold by
Evans Jodi A and Evans Fred F
Bought by
Barney Tim R
Current Estimated Value
Home Financials for this Owner
Home Financials are based on the most recent Mortgage that was taken out on this home.
Original Mortgage
$55,161
Outstanding Balance
$43,657
Interest Rate
3.73%
Mortgage Type
VA
Estimated Equity
$265,339
Purchase Details
Closed on
May 20, 2011
Sold by
Evans Fred F and Evans Jodi A
Bought by
Evans Jodi A and Evans Fred F
Home Financials for this Owner
Home Financials are based on the most recent Mortgage that was taken out on this home.
Original Mortgage
$41,700
Interest Rate
4.84%
Purchase Details
Closed on
Nov 10, 2010
Sold by
Wells Fargo Bank Na
Bought by
Evans Fred F and Evans Jodi A
Home Financials for this Owner
Home Financials are based on the most recent Mortgage that was taken out on this home.
Original Mortgage
$29,900
Interest Rate
4.16%
Purchase Details
Closed on
Aug 10, 2010
Sold by
Kouns Brett
Bought by
Wells Fargo Bank Na
Create a Home Valuation Report for This Property
The Home Valuation Report is an in-depth analysis detailing your home's value as well as a comparison with similar homes in the area
Purchase History
| Date | Buyer | Sale Price | Title Company |
|---|---|---|---|
| Barney Tim R | -- | First American Title Insuran | |
| Evans Jodi A | -- | -- | |
| Evans Fred F | -- | -- | |
| Wells Fargo Bank Na | $27,454 | -- |
Source: Public Records
Mortgage History
| Date | Status | Borrower | Loan Amount |
|---|---|---|---|
| Open | Barney Tim R | $55,161 | |
| Previous Owner | Evans Jodi A | $41,700 | |
| Previous Owner | Evans Fred F | $29,900 |
Source: Public Records
Tax History
| Year | Tax Paid | Tax Assessment Tax Assessment Total Assessment is a certain percentage of the fair market value that is determined by local assessors to be the total taxable value of land and additions on the property. | Land | Improvement |
|---|---|---|---|---|
| 2025 | $585 | $72,171 | $31,083 | $41,088 |
| 2024 | $585 | $135,292 | $51,164 | $84,128 |
| 2023 | $1,118 | $105,048 | $42,377 | $62,671 |
| 2022 | $889 | $93,144 | $40,918 | $52,226 |
| 2021 | $940 | $82,012 | $21,024 | $60,988 |
| 2020 | $794 | $65,307 | $17,520 | $47,787 |
| 2019 | $560 | $49,170 | $17,520 | $31,650 |
| 2018 | $627 | $49,170 | $17,520 | $31,650 |
| 2017 | $577 | $43,250 | $16,060 | $27,190 |
| 2016 | $255 | $43,250 | $0 | $0 |
| 2015 | $255 | $43,250 | $0 | $0 |
| 2014 | $255 | $43,250 | $0 | $0 |
Source: Public Records
Map
Nearby Homes
- 10 S 200 W
- 290 N 300 W
- 160 W 600 N
- 3810 N Burrville Rd
- 3810 N Burrville Rd
- 2033 S Sleepy Sage Ln
- 45 W Twin Creeks Rd
- Tbd 123 Monroe Canyon Rd
- 0 Monroe Mountain Rd
- 351 W Skyline Dr
- 2 N Landslide Rd E
- 123 Tbd Monroe Canyon Rd
- 7 W 725 N Unit 7
- 3 N Landslide Rd E Unit 3
- 123 Tbd West Cuonty Rd 1875
- 3 W 725 N Unit 3
- 4 W 725 N Unit 4
- 8 W 725 N Unit 8
- 1 N Landslide Rd E
- 528 E 700 S
Your Personal Tour Guide
Ask me questions while you tour the home.