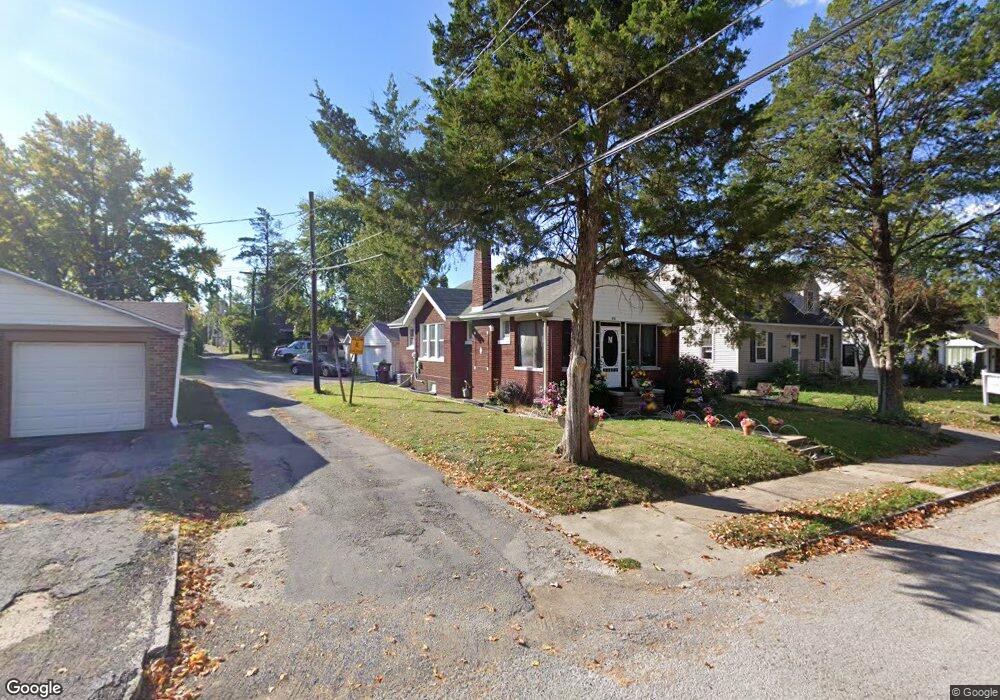
10 S 88th St Belleville, IL 62223
Estimated Value: $50,000 - $154,000
2
Beds
1
Bath
1,092
Sq Ft
$102/Sq Ft
Est. Value
About This Home
This home is located at 10 S 88th St, Belleville, IL 62223 and is currently estimated at $111,083, approximately $101 per square foot. 10 S 88th St is a home located in St. Clair County with nearby schools including Signal Hill Elementary School, Blessed Sacrament Catholic School, and Sister Thea Bowman Catholic School.
Ownership History
Date
Name
Owned For
Owner Type
Purchase Details
Closed on
Nov 13, 2013
Sold by
The Secretary Of Veterans Affairs
Bought by
Mahmood Nabeel
Current Estimated Value
Purchase Details
Closed on
Sep 19, 2013
Sold by
Sousa Ernest R
Bought by
The Secretary Of Veterans Affairs
Purchase Details
Closed on
Jun 8, 2010
Sold by
Sintzel Investments Inc
Bought by
Sousa Ernest R
Home Financials for this Owner
Home Financials are based on the most recent Mortgage that was taken out on this home.
Original Mortgage
$74,569
Interest Rate
5.13%
Mortgage Type
VA
Purchase Details
Closed on
Nov 5, 2009
Sold by
Long Doris Kay and Lance Claudine
Bought by
Sintzel Investments Inc
Purchase Details
Closed on
Jan 13, 2009
Sold by
Lance Claudine
Bought by
Lance Claudine and Claudine Lance Inter Vivos Trust
Create a Home Valuation Report for This Property
The Home Valuation Report is an in-depth analysis detailing your home's value as well as a comparison with similar homes in the area
Home Values in the Area
Average Home Value in this Area
Purchase History
| Date | Buyer | Sale Price | Title Company |
|---|---|---|---|
| Mahmood Nabeel | -- | First American Title Insuran | |
| The Secretary Of Veterans Affairs | -- | None Available | |
| Sousa Ernest R | $73,000 | Agape Title | |
| Sintzel Investments Inc | $27,000 | First American Title Ins | |
| Lance Claudine | -- | None Available |
Source: Public Records
Mortgage History
| Date | Status | Borrower | Loan Amount |
|---|---|---|---|
| Previous Owner | Sousa Ernest R | $74,569 |
Source: Public Records
Tax History Compared to Growth
Tax History
| Year | Tax Paid | Tax Assessment Tax Assessment Total Assessment is a certain percentage of the fair market value that is determined by local assessors to be the total taxable value of land and additions on the property. | Land | Improvement |
|---|---|---|---|---|
| 2024 | $3,416 | $34,983 | $4,257 | $30,726 |
| 2023 | $3,370 | $33,421 | $4,173 | $29,248 |
| 2022 | $3,081 | $30,088 | $3,757 | $26,331 |
| 2021 | $2,956 | $27,815 | $3,473 | $24,342 |
| 2020 | $2,871 | $26,304 | $3,284 | $23,020 |
| 2019 | $2,838 | $25,756 | $3,289 | $22,467 |
| 2018 | $2,769 | $25,199 | $3,218 | $21,981 |
| 2017 | $2,742 | $25,022 | $3,196 | $21,826 |
| 2016 | $2,685 | $24,490 | $3,128 | $21,362 |
| 2014 | $2,127 | $21,362 | $3,247 | $18,115 |
| 2013 | $2,068 | $24,695 | $3,293 | $21,402 |
Source: Public Records
Map
Nearby Homes
- 8612 Main St W
- 38 S 86th St
- 211 Country Club Ln
- 22 Country Club Place
- 121 Country Club Place
- 24 S 95th St
- 6 N 95th St
- 102 N 81st St
- 134 N 82nd St
- 324 N Powder Mill Rd
- 80 N 98th St
- 7813 W Main St
- 31 S 97th St
- 121 E Fairway Dr
- 20 Hilldale Dr
- 23 N 78th St
- 100 S 98th St
- 2 Bluff Dr
- 25 S 76th St
- 201 S Fairway Dr