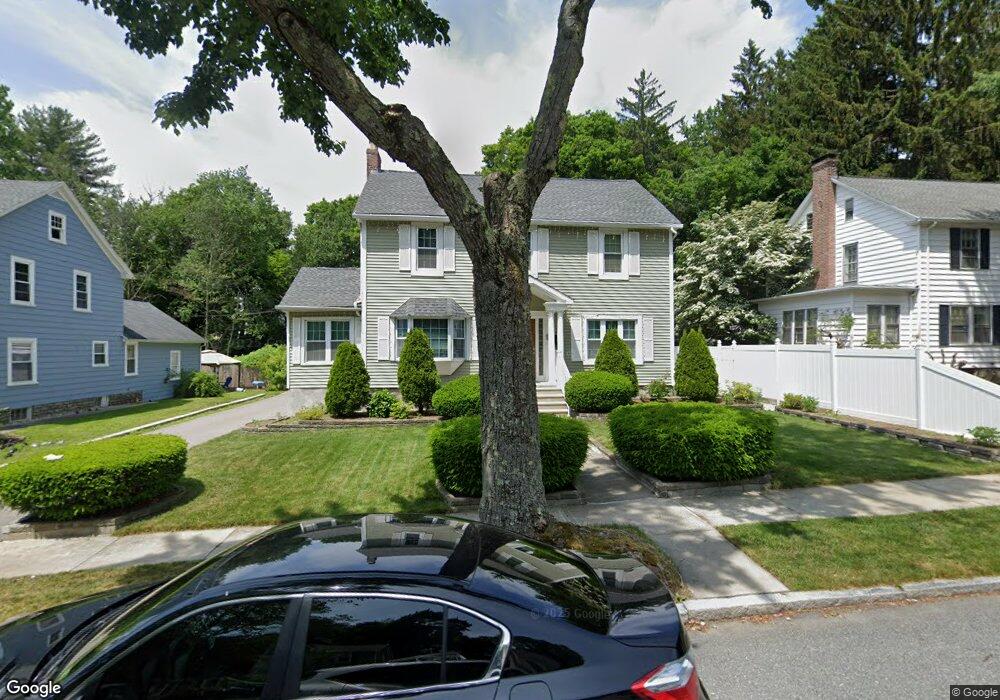
10 S Flagg St Worcester, MA 01602
Newton Square NeighborhoodEstimated Value: $549,021 - $569,000
4
Beds
2
Baths
2,241
Sq Ft
$249/Sq Ft
Est. Value
About This Home
This home is located at 10 S Flagg St, Worcester, MA 01602 and is currently estimated at $558,505, approximately $249 per square foot. 10 S Flagg St is a home located in Worcester County with nearby schools including Chandler Magnet, Jacob Hiatt Magnet School, and Midland Street.
Ownership History
Date
Name
Owned For
Owner Type
Purchase Details
Closed on
May 20, 2021
Sold by
Grullon Yoselin
Bought by
Grullon Yoselin and Grullon Pablo
Current Estimated Value
Home Financials for this Owner
Home Financials are based on the most recent Mortgage that was taken out on this home.
Original Mortgage
$269,500
Outstanding Balance
$241,863
Interest Rate
2.9%
Mortgage Type
New Conventional
Estimated Equity
$316,642
Purchase Details
Closed on
Dec 3, 2009
Sold by
Hyman Epstein T and Hyman Epstein
Bought by
Grullon Yoselin
Home Financials for this Owner
Home Financials are based on the most recent Mortgage that was taken out on this home.
Original Mortgage
$211,640
Interest Rate
5.01%
Mortgage Type
Purchase Money Mortgage
Create a Home Valuation Report for This Property
The Home Valuation Report is an in-depth analysis detailing your home's value as well as a comparison with similar homes in the area
Home Values in the Area
Average Home Value in this Area
Purchase History
| Date | Buyer | Sale Price | Title Company |
|---|---|---|---|
| Grullon Yoselin | -- | None Available | |
| Grullon Yoselin | -- | None Available | |
| Grullon Yoselin | $219,000 | -- | |
| Grullon Yoselin | $219,000 | -- | |
| Grullon Yoselin | $219,000 | -- |
Source: Public Records
Mortgage History
| Date | Status | Borrower | Loan Amount |
|---|---|---|---|
| Open | Grullon Yoselin | $269,500 | |
| Closed | Grullon Yoselin | $269,500 | |
| Previous Owner | Grullon Yoselin | $211,640 |
Source: Public Records
Tax History
| Year | Tax Paid | Tax Assessment Tax Assessment Total Assessment is a certain percentage of the fair market value that is determined by local assessors to be the total taxable value of land and additions on the property. | Land | Improvement |
|---|---|---|---|---|
| 2025 | $6,613 | $501,400 | $118,500 | $382,900 |
| 2024 | $6,463 | $470,000 | $118,500 | $351,500 |
| 2023 | $6,238 | $435,000 | $103,100 | $331,900 |
| 2022 | $5,795 | $381,000 | $82,500 | $298,500 |
| 2021 | $5,778 | $354,900 | $66,000 | $288,900 |
| 2020 | $6,227 | $366,300 | $66,000 | $300,300 |
| 2019 | $6,250 | $347,200 | $59,400 | $287,800 |
| 2018 | $6,168 | $326,200 | $59,400 | $266,800 |
| 2017 | $5,906 | $307,300 | $59,400 | $247,900 |
| 2016 | $5,995 | $290,900 | $43,500 | $247,400 |
| 2015 | $5,838 | $290,900 | $43,500 | $247,400 |
| 2014 | $5,735 | $293,500 | $43,500 | $250,000 |
Source: Public Records
Map
Nearby Homes
- 19 Kenilworth Rd
- 73 Moore Ave
- 31 Lenox St
- 16 Sherwood Rd
- 12 Cardinal Rd
- 26 Westbrook Rd
- 18 Hadwen Ln
- 24 Hadwen Rd
- 7 Longworth Rd
- 118 Beaconsfield Rd
- 42 Ellis Dr
- 122 Copperfield Rd
- 5 Franconia St
- 47R Yarnie Unit 3A
- 47R Yarnie Unit 1B
- 47R Yarnie Unit 2B
- 47R Yarnie Unit 4B
- 47R Yarnie Unit 8B
- 47R Yarnie Unit 5A
- 47R Yarnie Unit 6B
Your Personal Tour Guide
Ask me questions while you tour the home.