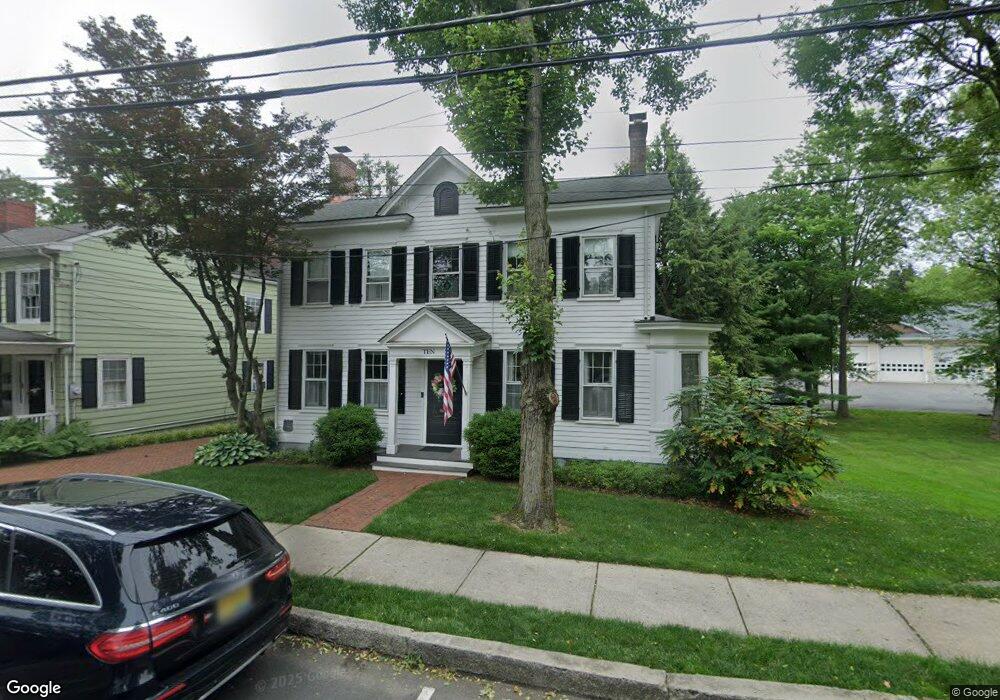
10 S Main St Cranbury, NJ 08512
Estimated Value: $920,000 - $1,100,000
4
Beds
3
Baths
2,938
Sq Ft
$350/Sq Ft
Est. Value
About This Home
This home is located at 10 S Main St, Cranbury, NJ 08512 and is currently estimated at $1,028,799, approximately $350 per square foot. 10 S Main St is a home located in Middlesex County with nearby schools including The Cranbury School, SciCore Academy, and E Windsor Knowledge Beginnings.
Ownership History
Date
Name
Owned For
Owner Type
Purchase Details
Closed on
Apr 22, 2011
Sold by
Mavoides Peter M and Mavoides Susan B
Bought by
Letter Richard and Hom Sarah
Current Estimated Value
Home Financials for this Owner
Home Financials are based on the most recent Mortgage that was taken out on this home.
Original Mortgage
$680,000
Outstanding Balance
$468,261
Interest Rate
4.76%
Mortgage Type
New Conventional
Estimated Equity
$560,538
Purchase Details
Closed on
Aug 14, 1998
Sold by
D'Agostino Elizabeth
Bought by
Mavoides Susan and Mavoidis Peter
Home Financials for this Owner
Home Financials are based on the most recent Mortgage that was taken out on this home.
Original Mortgage
$306,000
Interest Rate
6.94%
Create a Home Valuation Report for This Property
The Home Valuation Report is an in-depth analysis detailing your home's value as well as a comparison with similar homes in the area
Home Values in the Area
Average Home Value in this Area
Purchase History
| Date | Buyer | Sale Price | Title Company |
|---|---|---|---|
| Letter Richard | $850,000 | First American Title Ins Co | |
| Mavoides Susan | $340,000 | -- |
Source: Public Records
Mortgage History
| Date | Status | Borrower | Loan Amount |
|---|---|---|---|
| Open | Letter Richard | $680,000 | |
| Previous Owner | Mavoides Susan | $306,000 |
Source: Public Records
Tax History Compared to Growth
Tax History
| Year | Tax Paid | Tax Assessment Tax Assessment Total Assessment is a certain percentage of the fair market value that is determined by local assessors to be the total taxable value of land and additions on the property. | Land | Improvement |
|---|---|---|---|---|
| 2025 | $12,369 | $674,400 | $215,100 | $459,300 |
| 2024 | $12,193 | $674,400 | $215,100 | $459,300 |
| 2023 | $12,193 | $674,400 | $215,100 | $459,300 |
| 2022 | $12,018 | $674,400 | $215,100 | $459,300 |
| 2021 | $9,034 | $674,400 | $215,100 | $459,300 |
| 2020 | $12,004 | $674,400 | $215,100 | $459,300 |
| 2019 | $12,132 | $674,400 | $215,100 | $459,300 |
| 2018 | $13,279 | $674,400 | $215,100 | $459,300 |
| 2017 | $12,928 | $674,400 | $215,100 | $459,300 |
| 2016 | $13,036 | $674,400 | $215,100 | $459,300 |
| 2015 | $12,800 | $674,400 | $215,100 | $459,300 |
| 2014 | $12,847 | $674,400 | $215,100 | $459,300 |
Source: Public Records
Map
Nearby Homes